In this section we will be dealing on how to create pivot table from a Pandas dataframe in python with aggregate function – mean ,count and sum. Lets see how to create pivot table in pandas python with an example
Create dataframe:
import pandas as pd
import numpy as np
#Create a DataFrame
d = {
'Name':['Alisa','Bobby','Cathrine','Alisa','Bobby','Cathrine',
'Alisa','Bobby','Cathrine','Alisa','Bobby','Cathrine'],
'Exam':['Semester 1','Semester 1','Semester 1','Semester 1','Semester 1','Semester 1',
'Semester 2','Semester 2','Semester 2','Semester 2','Semester 2','Semester 2'],
'Subject':['Mathematics','Mathematics','Mathematics','Science','Science','Science',
'Mathematics','Mathematics','Mathematics','Science','Science','Science'],
'Score':[62,47,55,74,31,77,85,63,42,67,89,81]}
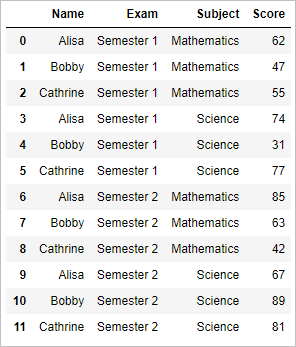
df = pd.DataFrame(d,columns=['Name','Exam','Subject','Score'])
df
The resultant dataframe will be
Create pivot table in pandas python with aggregate function mean:
# pivot table using aggregate function mean

pd.pivot_table(df, index=['Exam','Subject'], aggfunc='mean')
So the pivot table with aggregate function mean will be
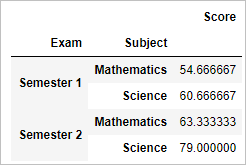
Which shows the average score of students across exams and subjects
Create pivot table in Pandas python with aggregate function sum:
# pivot table using aggregate function sum

pd.pivot_table(df, index=['Name','Subject'], aggfunc='sum')
So the pivot table with aggregate function sum will be
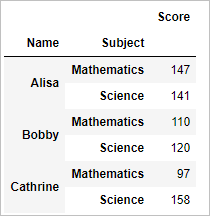
Which shows the sum of scores of students across subjects
Create pivot table in Pandas python with aggregate function count:
# pivot table using aggregate function count

pd.pivot_table(df, index=['Exam','Subject'], aggfunc='count')
So the pivot table with aggregate function count will be,
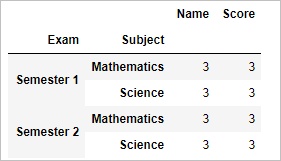
Which shows the count of student who appeared for the exam of different subject.
![]()
![]()

 function")

")

