
Select Random Samples in R with Dplyr – (sample_n() and sample_frac())
Sample_n() and Sample_frac () are the functions used to select random samples from the data set in R using Dplyr Package. Dplyr package in R is provided with sample_n() function which selects random n rows from a data frame.
Remove Duplicate rows in R using Dplyr – distinct ()
Distinct function in R is used to remove duplicate rows in R using Dplyr package. Dplyr package in R is provided with distinct() function which eliminate duplicates rows with single variable or with multiple variable.
distinct() Function in Dplyr – Remove duplicate rows of a dataframe:
library(dplyr)
mydata <- mtcars

# Remove duplicate rows of the dataframe
distinct(mydata)
Select variables (columns) in R using Dplyr – select () Function
Select function in R is used to select the columns in R using Dplyr package. Dplyr package in R is provided with select() function which select the columns based on conditions.
Drop variables (columns) in R using Dplyr
Drop variable in R can be done by using minus before the select function. Dplyr package in R is provided with select() function which is used to select or drop the columns based on conditions.
Drop by column names in Dplyr:
select() function along with minus which is used to drop the columns by name
library(dplyr)
mydata <- mtcars

# Drop the columns of the dataframe
select (mydata,-c(mpg,cyl,wt))
the above code drops mpg, cyl and wt columns
Drop 3rd, 4th and 5th columns of the dataframe:
library(dplyr)
mydata <- mtcars

# Drop 3rd,4th and 5th columns of the dataframe
select(mydata,-c(3,4,5))
the above code drops 3rd, 4th and 5th column
Re arrange or Re order the column of dataframe in R using Dplyr
Re Arranging or Re order the column of dataframe in R using Dplyr. Dplyr package in R is provided with select() function which re orders the columns.
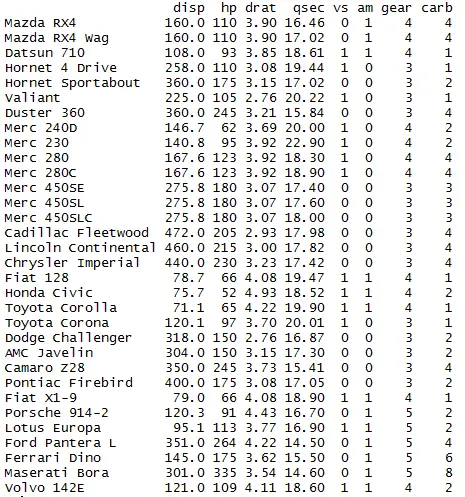
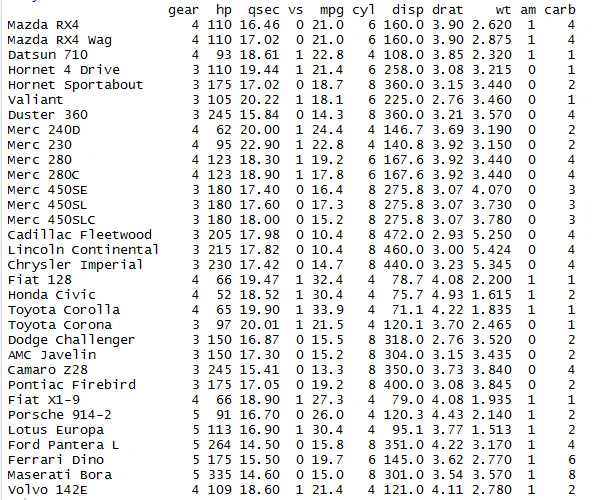
Re order the column using select function with gear,hp,qsec,vs columns arranged in order.
library(dplyr)
mydata <- mtcars

# Reorder the columns of the dataframe

Mydata1 = select(mydata, gear,hp,qsec,vs, everything())
Mydata1
Rename the column name in R using Dplyr
Rename the column name or variable name in R using Dplyr. Dplyr package in R is provided with rename() function which re names the column name or column variable.
Rename the column name in R using Dplyr:
Rename the column name using rename function in dplyr.
library(dplyr)
mydata <- mtcars

# Rename the column name of the dataframe
Mydata1 = rename(mydata, displacement=disp, cylinder=cyl)
Mydata1
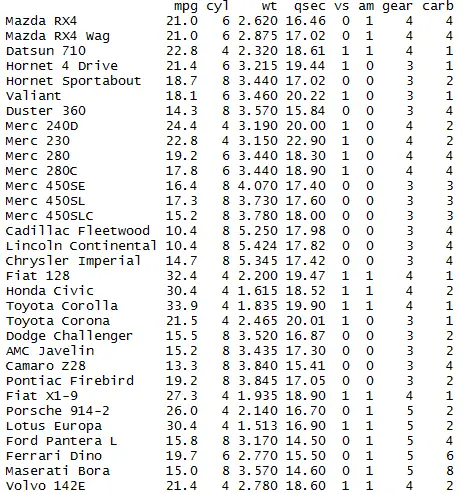
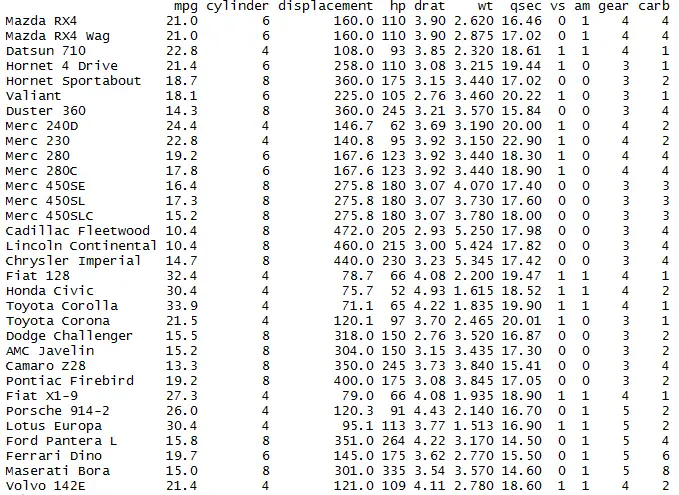
Rename the column name disp with displacement and cyl with cylinder
Filter or subsetting rows in R using Dplyr
Filter or subsetting rows in R can be done using Dplyr. Dplyr package in R is provided with filter() function which subsets the rows with multiple conditions.
Filter or subsetting the rows in R using Dplyr:
Subset using filter() function.
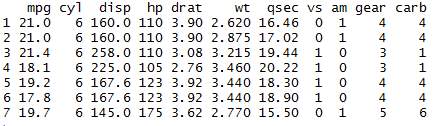
library(dplyr)
mydata <- mtcars

# subset the rows of dataframe with condition
Mydata1 = filter(mydata,cyl==6)
Mydata1
Only the rows with cyl =6 is filtered
Filter or subsetting the rows in R with multiple conditions using Dplyr:
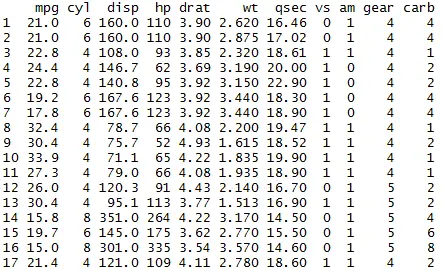
library(dplyr)
mydata <- mtcars

# subset the rows of dataframe with multiple conditions
Mydata1 = filter(mydata, gear %in% c(4,5))
Mydata1
The rows with gear=4 or 5 are filtered
Get the summary of dataset in R using Dplyr – summarise()
Summary of the dataset (Mean, Median and Mode) in R can be done using Dplyr. Dplyr package in R is provided with summarise() function which gets the summary of dataset in R. Dplyr package has summarise(), summarise_at(), summarise_if(), summarise_all()
Summary of column in dataset in R using Dplyr – summarise()
library(dplyr)
mydata <- mtcars

# summarise the columns of dataframe
summarise(mydata, mpg_mean=mean(mpg),mpg_median=median(mpg))
summarise() function that gets the mean and median of mpg.
![]()
Summary of multiple column of dataset in R using Dplyr – summarise_at()
library(dplyr)
mydata <- mtcars

# summarise the list of columns of dataframe
summarise_at(mydata, vars(mpg, hp), funs(n(), mean, median))
summarise_at() function that gets the number of rows, mean and median of mpg and hp.
![]()
Sorting DataFrame in R using Dplyr
Sorting the dataframe in R can be done using Dplyr. Dplyr package in R is provided with arrange() function which sorts the dataframe by multiple conditions.
Group by function in R using Dplyr
Group by Function in R is used to group the dataframe in R. Dplyr package in R is provided with group_by() function which groups the dataframe by multiple columns with mean, sum or any other functions.
We will be using iris data to depict the example of group_by() function
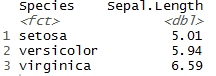
library(dplyr)
mydata2 <- iris

# Groupby function for dataframe in R
summarise_at(group_by(mydata2,Species),vars(Sepal.Length),funs(mean(.,na.rm=TRUE)))
Mean of Sepal.Length is grouped by Species variable.
Groupby function in R with dplyr pipe operator %>%:
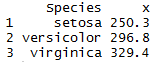
library(dplyr) mydata2 <- iris # Group by function for dataframe in R using pipe operator mydata2 %>% group_by(Species) %>% summarise_at(vars(Sepal.Length),funs(sum(.,na.rm=TRUE)))
Sum of Sepal.Length is grouped by Species variable with the help of pipe operator (%>%) in dplyr package.
So the output will be
Windows Function in R using Dplyr
Like SQL, dplyr uses window functions that are used to subset data within a group. It returns a vector of values. We could use min_rank() function that calculates rank.
Create new variable in R using Mutate Function in dplyr
Mutate Function in R is used to create new variable or column to the dataframe in R. Dplyr package in R is provided with mutate(), mutate_all() and mutate_at() function which creates the new variable to the dataframe.
We will be using iris data to depict the example of mutate() function
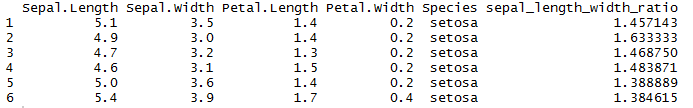
library(dplyr)
mydata2 <- iris

# Mutate function for creating new variable to the dataframe in R

mydata3 = mutate(mydata2, sepal_length_width_ratio=Sepal.Length/Sepal.Width)
head(mydata3)
New column named sepal_length_width_ratio is created using mutate function and values are populated by dividing sepal length by sepal width
mutate_all() Function in R
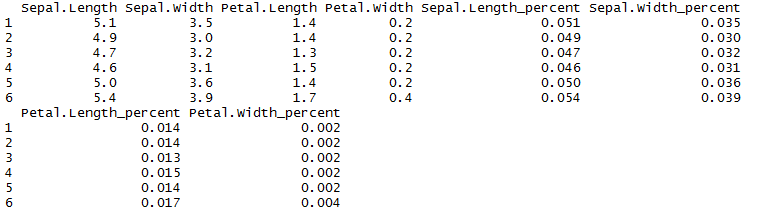
mutate_all() function in R creates new columns for all the available columns here in our example. mutate_all() function creates 4 new column and get the percentage distribution of sepal length and width, petal length and width.
library(dplyr)
mydata2 <- iris

# Mutate_all function for creating new variable to the dataframe in R

mydata3 = mutate_all(mydata2[,-5], funs("percent"= ./100))
head(mydata3)
mutate_at() Function in R
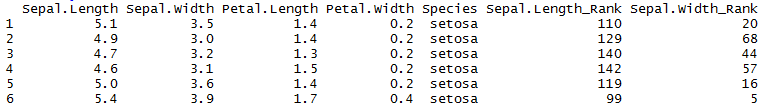
mutate_at() function in R creates new columns for the specified columns here in our example. mutate_at() Function get the min_rank() of sepal length and sepal width .
library(dplyr)
mydata2 <- iris

# mutate_at() function for creating new variable to the dataframe in R

mydata4 = mutate_at(mydata2, vars(Sepal.Length,Sepal.Width), funs(Rank=min_rank(desc(.))))
head(mydata4)
Union Function & union_all in R using Dplyr (union of data frames)
Union of two data frames in R can be easily achieved by using union Function and union all function in Dplyr package . Dplyr package in R is provided with union(), union_all() function
Intersect Function in R using Dplyr (intersection of data frames)
Intersection of two data frames in R can be easily achieved by using intersect Function in Dplyr package . Dplyr package in R is provided with intersect() function
Intersect function takes the rows that appear in both the tables and create the dataframe.
library(dplyr)

#  intersect two dataframes
intersect(df1,df2)
Setdiff() Function in R using Dplyr (get difference of dataframes)
To get the difference of two data frames i.e. To get the row present in one table which is not in other table we will be using setdiff() function in R ‘s Dplyr package . Dplyr package in R is provided with setdiff() function which gets the difference of two dataframe.
Case when statement in R using case_when() Dplyr
Case when statement in R can be executed with case_when() function in dplyr package. Dplyr package is provided with case_when() function which is similar to case when statement in SQL.
We will be using iris data to depict the example of case_when() function.
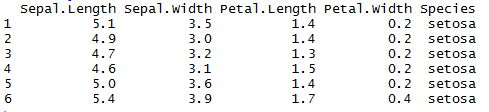
library(dplyr)

mydata2 <- iris
head(mydata2)
iris data will be looking like
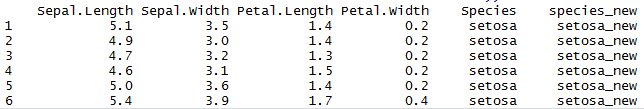
We will be creating additional variable species_new using mutate function and case when statement.
mydata2 %>% mutate(species_new = case_when(is.na(Species) ~ "missing",
                                           Species=="setosa" ~ "setosa_new",
                                           Species=="versicolor" ~ "versicolor_new",
                                           Species=="virginica" ~ "virginica_new",
                                           TRUE ~ "others"))
- you can use variables directly within case_when() wrapper.
- TRUE equivalent to ELSE statement .
So the snapshot of resultant data frame will be
NOTE: Make sure you set is.na() condition at the beginning of R case_when to handle the missing values.
Row wise operation in R using Dplyr
Row wise operation in R can be performed using rowwise() function in dplyr package. Dplyr package is provided with rowwise() function with which we will be doing row wise maximum or row wise minimum operations.
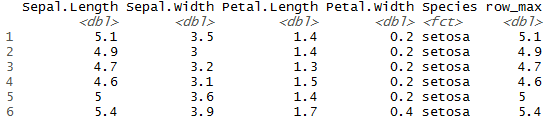
We will be creating additional variable row_max using mutate function and rowwise() function to store the row wise maximum variable.
df1 = mydata2 %>%
  rowwise() %>% mutate(row_max= max(Sepal.Length:Petal.Width))

head(df1)
So the snapshot of resultant data frame will be
Quantile, Decile and Percentile can be calculated using ntile() Function in R. Dplyr package is provided with mutate() function and ntile() function. The ntile() function is used to divide the data into N bins. ntile() function will be useful in creating the column with percentile, decile and quantile rank
Decile rank in R:
library(dplyr)

mydata <- mtcars
df1 = mutate(mydata, decile_rank = ntile(mydata$mpg,10))
df1
So in the resultant data frame decile rank is calculated and populated across
![]()
Percentile rank in R:
library(dplyr)

mydata <- mtcars
df1 = mutate(mydata, percentile_rank = ntile(mydata$mpg,100))
df1
So in the resultant data frame percentile rank is calculated and populated across
![]()
![]()
 and sample_frac())")

 function")


")