In this Section we will be explaining Pyspark concepts one by one. This set of topics on pyspark is designed to make pyspark learning in quick and easy way. lets get started with pyspark Learning
Inner Join in pyspark is the simplest and most common type of join. It is also known as simple join or Natural Join. Inner join returns the rows when matching condition is met.
### Get Duplicate rows in pyspark

df1=df_basket1.groupBy("Item_group","Item_name","price").count().filter("count >1")
df1.drop('count').show()
First we do groupby count of all the columns i.e. “Item_group”,”Item_name”,”price”
Secondly we filter the rows with count greater than 1.
In order to calculate the quantile rank , decile rank and n tile rank in pyspark we use ntile() Function. By passing argument 4 to ntile() function quantile rank of the column in pyspark is calculated. By passing argument 10 to ntile() function decile rank of the column in pyspark is calculated.
In order to populate row number in pyspark we use row_number() Function. row_number() function along with partitionBy() of other column populates the row number by group. Let’s see an example on how to populate row number in pyspark.
In order to calculate the percentile rank of the column in pyspark we use percent_rank() Function. percent_rank() function along with partitionBy() of other column calculates the percentile Rank of the column by group. Let’s see an example on how to calculate percentile rank of the column in pyspark.
simple + operator and dividing the result by number of columns to calculate mean of two or more columns in pyspark, and appending the results to the dataframe
### Mean of two or more columns in pyspark

from pyspark.sql.functions import col

df1=df_student_detail.withColumn("mean_of_col", (col("mathematics_score")+col("science_score"))/2)
df1.show()
we will be using simple + operator to calculate sum of two or more columns in pyspark, and appending the results to the dataframe by naming the column as sum
### Sum of two or more columns in pyspark

from pyspark.sql.functions import col

df1=df_student_detail.withColumn("sum", col("mathematics_score")+col("science_score"))
df1.show()
In order to calculate the row wise mean, sum, minimum and maximum in pyspark, we will be using different functions. Row wise mean in pyspark is calculated in roundabout way. Row wise sum in pyspark is calculated using sum() function. Row wise minimum (min) in pyspark is calculated using least() function. Row wise maximum (max) in pyspark is calculated using greatest() function.
n order to type cast an integer to decimal in pyspark we will be using cast() function with DecimalType() as argument. To type cast integer to float in pyspark we will be using cast() function with FloatType() as argument. Let’s see an example of type conversion or casting of integer column to decimal column and integer column to float column in pyspark.
Type cast an integer column to decimal column in pyspark
Type cast an integer column to float column in pyspark
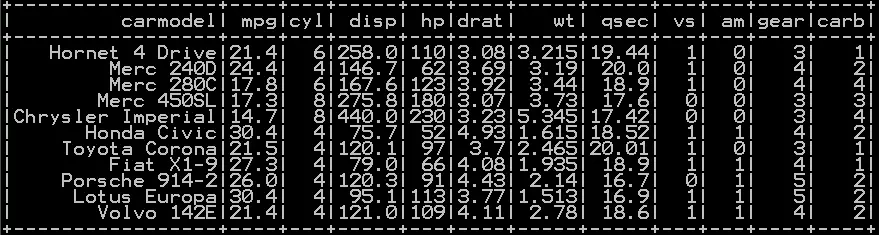
Set difference in Pyspark returns the rows that are in the one dataframe but not other dataframe. Set difference performs set difference i.e. difference of two dataframe in Pyspark.
Syntax:
df1.subtract(df2)
df1 – dataframe1 df2 – dataframe2
dataframe1.subtract(dataframe2) gets the difference of dataframe2 from dataframe1.
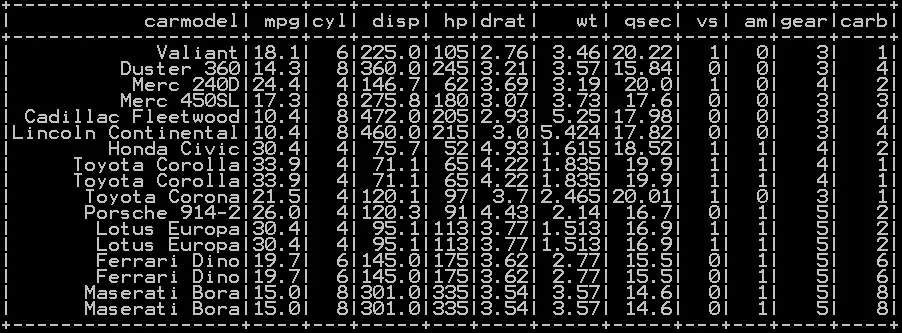
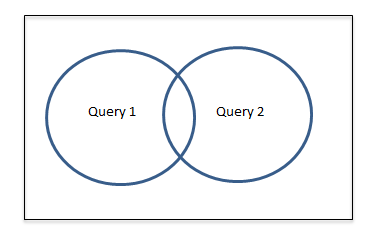
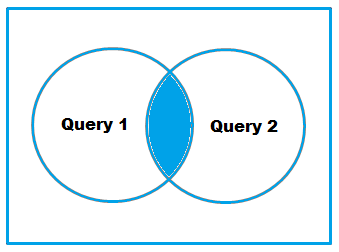
Intersect of two dataframe in pyspark can be accomplished using intersect() function. Intersection in Pyspark returns the common rows of two or more table. Intersect removes the duplicate after combining.
Intersect of two dataframe in pyspark performs a DISTINCT on the result set, returns the common rows of two different tables
Intersect of two dataframe in pyspark
Intersect of two or more dataframe in pyspark – (more than two dataframe)
In order to sort the dataframe in pyspark we will be using orderBy() function. orderBy() Function in pyspark sorts the dataframe in by single column and multiple column. It also sorts the dataframe in pyspark by descending order or ascending order. Let’s see an example of each.
Sort the dataframe in pyspark by single column – ascending order
Sort the dataframe in pyspark by single column – descending order
Sort the dataframe in pyspark by multiple columns – ascending order
Sort the dataframe in pyspark by multiple columns – descending order
In order to drop rows in pyspark we will be using different functions in different circumstances. Drop rows with conditions in pyspark are accomplished by dropping NA rows, dropping duplicate rows and dropping rows by specific conditions in a where clause etc. Let’s see an example for each on dropping rows in pyspark with multiple conditions.
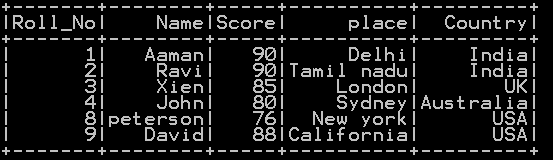
In order to get the distinct value of a column in pyspark we will be using select() and distinct() function. There is another way to get distinct value of the column in pyspark using dropDuplicates() function. Let’s see with an example for both
Distinct value of a column in pyspark using distinct() function
### Get distinct value of column

df.select("name").distinct().show()
Count of Missing and null values in pyspark can be accomplished using isnan() function and isNull() function respectively. isnan() function returns the count of missing values of column in pyspark – (nan, na) . isnull() function returns the count of null values of column in pyspark
Mean, Variance and standard deviation of column in pyspark can be accomplished using aggregate() function with argument column name followed by mean , variance and standard deviation according to our need. Mean, Variance and standard deviation of the group in pyspark can be calculated by using groupby along with aggregate() Function. We will see with an example for each
Mean of the column in pyspark with example
Variance of the column in pyspark with example
Standard deviation of column in pyspark with example
Mean of each group of dataframe in pyspark with example
Variance of each group of dataframe in pyspark with example
Standard deviation of each group of dataframe in pyspark with example
Maximum and minimum value of the column in pyspark can be accomplished using aggregate() function with argument column name followed by max or min according to our need. Maximum or Minimum value of the group in pyspark can be calculated by using groupby along with aggregate() Function. We will see with an example for each
Maximum value of the column in pyspark with example
Minimum value of the column in pyspark with example
Raised to the power column in pyspark can be accomplished using pow() function with argument column name followed by numeric value which is raised to the power. We will see Raised to power of column in pyspark with an example
Raised to power n of the column in pyspark with example
Deleting or Dropping column in pyspark can be accomplished using drop() function. drop() Function with argument column name is used to drop the column in pyspark. We will see how to
Drop single column in pyspark with example
Drop multiple column in pyspark with example
Drop column like function in pyspark – drop similar column
In order to filter data with conditions in pyspark we will be using filter() function. filter() function subsets or filters the data with single or multiple conditions in pyspark. Let’s get clarity with an example.
Subset or filter data with single condition
Subset or filter data with multiple conditions (multiple or condition in pyspark)
Subset or filter data with multiple conditions (multiple and condition in pyspark)
Subset or filter data with conditions using sql functions
Filter using Regular expression in pyspark
Filter starts with and ends with keyword in pyspark
Filter with null and non null values in pyspark
Filter with LIKE% and in operator in pyspark
Subset or filter data with single condition in pyspark
Subset or filter data with single condition in pyspark can be done using filter function() with conditions inside the filter function.
## subset with single condition

df.filter(df.mathematics_score > 50).show()
In order to calculate Frequency table or cross table in pyspark we will be using crosstab() function. Frequency table in pyspark can be calculated in roundabout way using group by count. Cross table in pyspark can be calculated using crosstab() function. Let’s get clarity with an example.
Groupby functions in pyspark which is also known as aggregate function in pyspark is calculated using groupby(). Groupby single column and multiple column is shown with an example of each. We will be using aggregate function to get groupby count, groupby mean, groupby sum, groupby min and groupby max of dataframe in pyspark. Let’s get clarity with an example.
Groupby count of dataframe in pyspark – Groupby single and multiple column
Groupby sum of dataframe in pyspark – Groupby single and multiple column
Groupby mean of dataframe in pyspark – Groupby single and multiple column
Groupby min of dataframe in pyspark – Groupby single and multiple column
Groupby max of dataframe in pyspark – Groupby single and multiple column
In order to calculate Descriptive statistics or Summary Statistics of dataframe in pyspark we will be using describe() function. Descriptive statistics or summary statistics of a column can also be calculated with describe() function. Lets get clarity with an example.
Descriptive statistics or summary statistics of dataframe in pyspark
Descriptive statistics or summary statistics of a numeric column in pyspark
Descriptive statistics or summary statistics of a character column in pyspark
Descriptive statistics in pyspark generally gives the
In order to Re arrange or re order the column in pyspark we will be using select function. To reorder the column in ascending order we will be using Sorted function. To reorder the column in descending order we will be using Sorted function with an argument reverse =True. lets get clarity with an example.
Re arrange the column in pyspark
Re order the column in pyspark in ascending order
Re order the column in pyspark in descending order
In order to calculate cumulative sum of column in pyspark we will be using sum function and partitionBy. To calculate cumulative sum of a group in pyspark we will be using sum function and also we mention the group on which we want to partitionBy lets get clarity with an example.
In order to calculate percentage and cumulative percentage of column in pyspark we will be using sum() function and partitionBy(). We will explain how to get percentage and cumulative percentage of column in Pyspark with an example.
Calculate Percentage of column in pyspark
Calculate cumulative percentage of column in pyspark
In order to select column in pyspark we will be using select function. Select() function is used to select single column and multiple columns in pyspark. Select column name like in pyspark. We will explain how to select column in Pyspark with an example.
Select single column in pyspark
Select multiple column in pyspark
Select column name like in pyspark
Select column name using regular expression in pyspark
In order to Get data type of column in pyspark we will be using dtypes function and printSchema() function . We will explain how to get data type of single and multiple columns in Pyspark with an example.
In order to Get list of columns and its data type in pyspark we will be using dtypes function and printSchema() function . We will explain how to get list of column names and its data type in pyspark with an example.
In order to read csv file in Pyspark and convert to dataframe, we import SQLContext. We will explain step by step how to read a csv file and convert them to dataframe in pyspark with an example.
We have used two methods to convert CSV to dataframe in Pyspark
With close to 10 years on Experience in data science and machine learning Have extensively worked on programming languages like R, Python (Pandas), SAS, Pyspark.


, SampleBy()")
 function in R")
")
 Function in R")

")
 function in R")
")