In order to calculate Frequency table or cross table in pyspark we will be using crosstab() function. Frequency table in pyspark can be calculated in roundabout way using group by count. Cross table in pyspark can be calculated using crosstab() function. Let’s get clarity with an example.
- Calculate Frequency table in pyspark with example
- Compute Cross table in pyspark with example – two way cross table / frequency table
- Compute Cross table in pyspark using groupby function
We will be using df_basket1

Frequency table in pyspark:
Frequency table in pyspark can be calculated in roundabout way using group by count. The dataframe is grouped by column named “Item_group” and count of occurrence is calculated which in turn calculates the frequency of “Item_group”.
## Frequency table in pyspark
df_basket1.groupBy("Item_group").count().show()
Column name is passed to groupBy function along with count() function as shown, which gives the frequency table

Cross table in pyspark : Method 1
Cross table in pyspark can be calculated using crosstab() function. Cross tab takes two arguments to calculate two way frequency table or cross table of these two columns.
## Cross table in pyspark

df_basket1.crosstab('Item_group', 'price').show()
Cross table of “Item_group” and “price” is shown below

Cross table in pyspark : Method 2
Cross table in pyspark can be calculated using groupBy() function. groupBy() function takes two columns arguments to calculate two way frequency table or cross table.
## Cross table in pyspark
df_basket1.groupBy("Item_group","price").count().show()
Cross table of “Item_group” and “price” columns is shown below

Comparison of Two way cross table in Method 1 and Method 2:
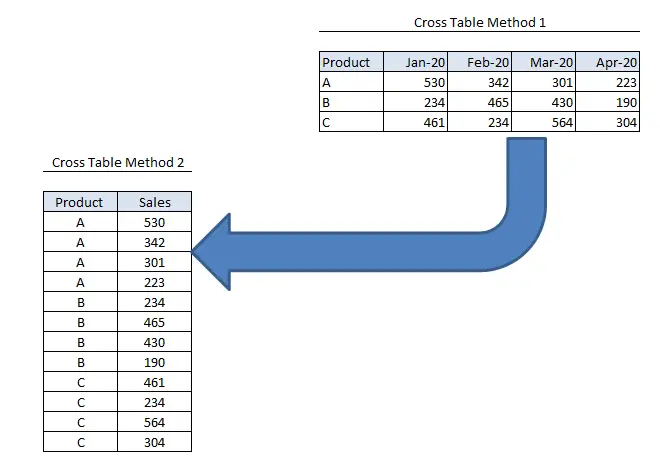
Method 1 Takes up one value along the rows and other value on the columns and cells represents the frequency where as in method 2 Long format i.e. both values are represented as rows and frequency is populated accordingly.
Other Related Topics:
- Populate row number in pyspark – Row number by Group
- Percentile Rank of the column in pyspark
- Mean of two or more columns in pyspark
- Sum of two or more columns in pyspark
- Row wise mean, sum, minimum and maximum in pyspark
- Rename column name in pyspark – Rename single and multiple column
- Typecast Integer to Decimal and Integer to float in Pyspark
- Get number of rows and number of columns of dataframe in pyspark
- Extract Top N rows in pyspark – First N rows
- Absolute value of column in Pyspark – abs() function
- Set Difference in Pyspark – Difference of two dataframe
- Union and union all of two dataframe in pyspark (row bind)
- Intersect of two dataframe in pyspark (two or more)
- Round up, Round down and Round off in pyspark – (Ceil & floor pyspark)
- Sort the dataframe in pyspark – Sort on single column & Multiple column.
![]()
![]()
")


 function in Python Pandas")
")