In order to Create Frequency table of column in pandas python we will be using value_counts() function. crosstab() function in pandas used to get the cross table or frequency table. Let’s see how to create frequency matrix or frequency table of column in pandas.
- Frequency table in pandas python using value_count() function
- Frequency table in pandas python using crosstab() function
- groupby() count function is used to get the frequency count of the dataframe
- two way frequency table using crosstab() function
- two way frequency of table using proportion / row proportion and column proportions.
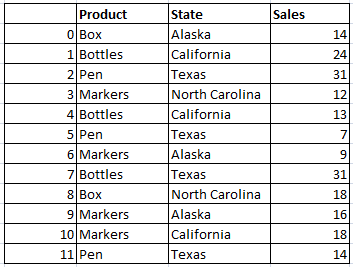
First let’s create a dataframe
import pandas as pd
import numpy as np

data = {'Product':['Box','Bottles','Pen','Markers','Bottles','Pen','Markers','Bottles','Box','Markers','Markers','Pen'],
       'State':['Alaska','California','Texas','North Carolina','California','Texas','Alaska','Texas','North Carolina','Alaska','California','Texas'],
       'Sales':[14,24,31,12,13,7,9,31,18,16,18,14]}

df1=pd.DataFrame(data, columns=['Product','State','Sales'])

df1
df1 will be
Get frequency table of column in pandas python: Method 1
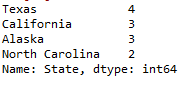
Frequency table of column in pandas for State column can be created using value_counts() as shown below.
df1.State.value_counts()
So the frequency table will be
Get frequency table of column in pandas python: Method 2
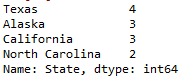
Frequency table of column in pandas for State column can be created using value_counts() as shown below.
df1['State'].value_counts()
So the frequency table will be
Get frequency table of column in pandas python : Method 3 crosstab()
Frequency table of column in pandas for State column can be created using crosstab() function as shown below. crosstab() function takes up the column name as argument counts the frequency of occurrence of its values
### frequency table using crosstab()function

import pandas as pd
my_tab = pd.crosstab(index=df1["State"], columns="count")
my_tab
So the frequency table will be
Get frequency table of column in pandas python : Method 4 Groupby count()
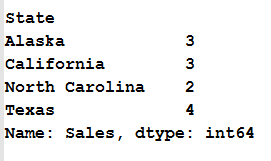
groupby() function takes up the column name as argument followed by count() function as shown below which is used to get the frequency table of the column in pandas
#### Get frequency table of the column using Groupby count()

df1.groupby(['State'])['Sales'].count()
so the result with frequency table will be
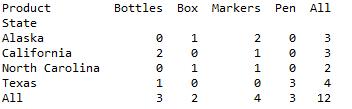
Two way frequency table using crosstab() function:
Two way Frequency table of column in pandas for “State” column and “Product” column can be created using crosstab() function as shown below. crosstab() function takes up the column names “State” to index and “Product” to column as argument counts the frequency of the cross tabulations
### frequency table using crosstab()function

import pandas as pd
my_crosstab = pd.crosstab(index=df1["State"],
                            columns=df1["Product"],
                             margins=True)   # Include row and column totals
my_crosstab
So the resultant two way frequency table will be
Two way frequency table : Get proportion using crosstab() function
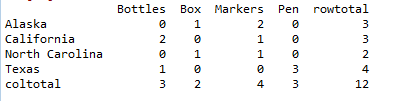
STEP 1 : Rename to get row total and column total
To get the over all proportion lets first rename the two way cross table. The columns and index of the two way cross table is renamed to get the row total and column total as shown below
#### Rename the index and columns

my_crosstab.columns = ["Bottles" , "Box" , "Markers" , "Pen" ,"rowtotal"]
my_crosstab.index= ["Alaska","California","North Carolina","Texas","coltotal"]
my_crosstab
so the renamed frequency table will be
Step 2: Get over all proportion of the frequency table
the cross table is divided by row total and column total to get the proportion as shown below
#### Get the over all proportion

my_crosstab/my_crosstab.ix["coltotal","rowtotal"]
so the cross table with proportion will be

Two way frequency table : Get column wise proportion using crosstab() function
the cross table is divided by column total to get the column wise proportion as shown below
#### Get the column proportion

my_crosstab/my_crosstab.ix["coltotal"]
so the cross table with column wise proportion will be
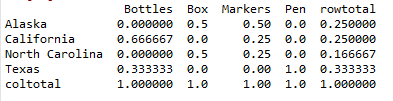
Two way frequency table : Get row wise proportion using crosstab() function
the cross table is divided by row total to get the row wise proportion as shown below
#### Get the row proportion

my_crosstab.div(my_crosstab["rowtotal"],axis=0)
so the row table with row wise proportion will be

Other related topics:
- Get the percentage of a column in pandas python
- Cumulative percentage of a column in pandas python
- Cumulative sum of a column in pandas python
- Difference of two columns in pandas dataframe – python
- Sum of two or more columns of pandas dataframe in python
- Set difference of two dataframe in Pandas python
- Intersection of two dataframe in Pandas python
to read on more you refer the documentation.
![]()
![]()
")
")


