Table function in R -table(), performs categorical tabulation of data with the variable and its frequency. Table() function is also helpful in creating Frequency tables with condition and cross tabulations.
Lets see usage of R table() function with some examples
- Frequency table in R with table() function
- Cross table or Frequency table with proportion
- Two way Cross table or Two way frequency table along with proportion in R
- Three way frequency table or three way cross table in R.
Frequency table with table function in R :
Main Objective of table function in R is creating Frequency table. Lets use iris data set to demonstrate our example. Lets create a frequency table for types of species in iris.
## Frequency table with table() function in R

table(iris$Species)
when we execute the above code, the output will be
![]()
Which says that there are 50 observation in each species (setosa, versicolor & virginica)
Frequency Table with Proportion:
proportion of the frequency table is created using prop.table() function. Table is passed as an argument to the prop.table() function. so that the proportion of the frequency table is calculated
## Frequency table with with proportion using table() function in R

table1 = as.table(table(iris$Species))
prop.table(table1)
which results in proportion as output
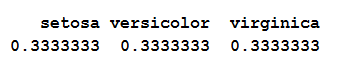
Which says that there are 50 observation in each species (setosa, versicolor & virginica) out of total 150. so each species contributes to 33% percent as shown.
Frequency table with condition:
We can also create a frequency table with predefined condition using R table() function.For example lets say we need to get how many obervations have Sepal.Length>5.0 in iris table.
## Frequency table with condition using table function in R

table(iris$Sepal.Length>5.0)
when we execute the above code the output will be
FALSE TRUE
32 118
Which says there are
- 118 observation with Sepal.Length >5.0
- 32 observation with Sepal.Length <=5.0
2 way cross table in R:
Table function also helpful in creating 2 way cross table in R. For example lets say we need to create cross tabulation of gears and carb in mtcars table
## cross tabulation gear * carb

table(mtcars$gear,mtcars$carb)
when we execute the above code the output will be
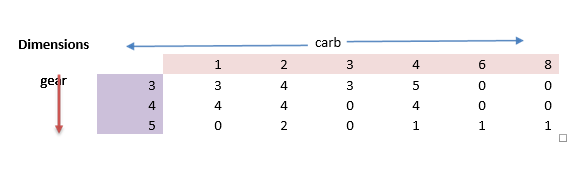
Which says there are 3 cars which has carb=1 and gear=3 and so on.
Two way Frequency Table with Proportion:
proportion of the frequency table is created using prop.table() function. Table is passed as an argument to the prop.table() function. so that the proportion of the two way frequency table is calculated
## Frequency table with with proportion using table() function in R

table1 = as.table(table(mtcars$gear,mtcars$carb))
prop.table(table1)
which results in proportion as output
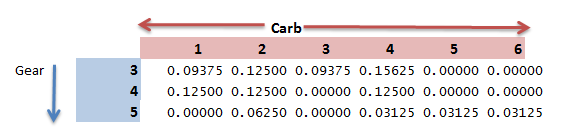
with total covering to 100% percent as shown.
Note :
- prop.table(table_name,1) will give Row wise proportion in frequency table, with row wise proportion equal to 100% percent.
- prop.table(table_name,2) will give column wise proportion in frequency table, with column wise proportion equal to 100% percent.
3 way cross table in R:
Similar to 2 way cross table we can create a 3 way cross table in R with the help of table function.
## 3 way cross tabulation gear * carb* cyl with table function in R

table(mtcars$gear,mtcars$carb,mtcars$cyl)
when we execute the above code the output will be
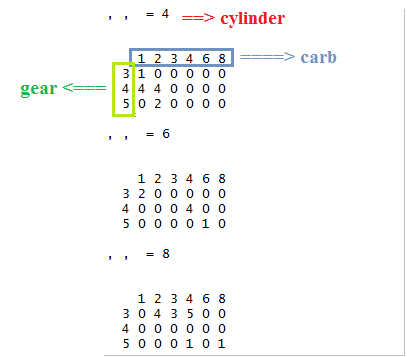
Indirectly it gives the cross tabulation of gear* carb for cyl=4,cyl=6 and cyl=8 separately as shown above.
![]()
![]()

")


