In order to calculate Descriptive statistics or Summary Statistics of dataframe in pyspark we will be using describe() function. Descriptive statistics or summary statistics of a column can also be calculated with describe() function. Lets get clarity with an example.
- Descriptive statistics or summary statistics of dataframe in pyspark.
- Descriptive statistics or summary statistics of a numeric column in pyspark
- Descriptive statistics or summary statistics of a character column in pyspark
- Mean, Min and Max of a column in pyspark using select() function.
Descriptive statistics in pyspark generally gives the
-
- Count – Count of values of each column
- Mean – Mean value of each column
- Stddev – standard deviation of each column
- Min – Minimum value of each column
- Max – Maximum value of each column
Syntax:
df – dataframe
We will use the dataframe named df.
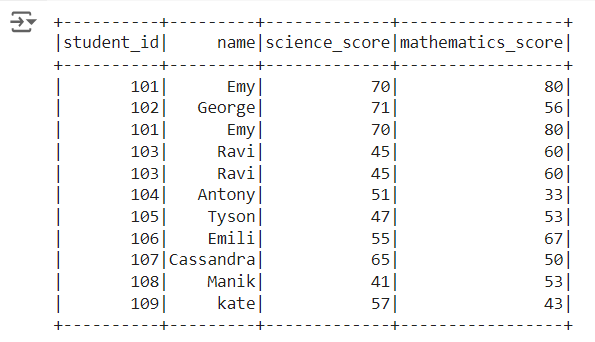
Descriptive statistics or summary statistics of dataframe in pyspark:
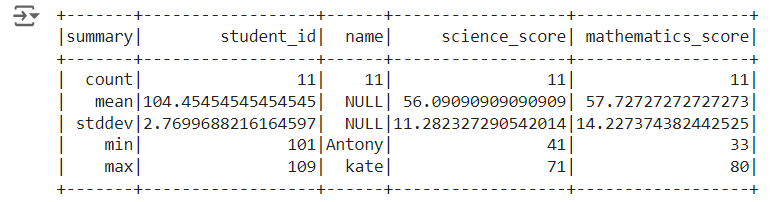
dataframe.describe() gives the descriptive statistics of each column. The descriptive statistics include
- Count – Count of values of each column
- Mean – Mean value of each column
- Stddev – standard deviation of each column
- Min – Minimum value of each column
- Max – Maximum value of each column
## summary statistics or descriptive statistics of dataframe
df.describe().show()
Descriptive statistics or summary statistics of a numeric column in pyspark : Method 1
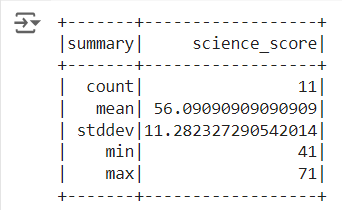
dataframe.select(‘column_name’).describe() gives the descriptive statistics of single column.
## summary statistics of a column (numeric column)
df.select('science_score').describe().show()
Descriptive statistics or summary statistics of a numeric column in pyspark : Method 2
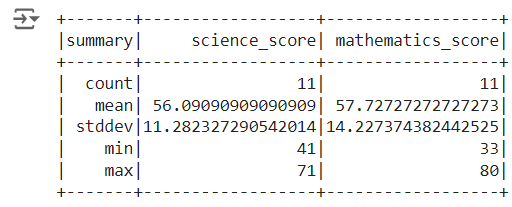
The columns for which the summary statistics needs to found is passed as argument to the describe() function which gives gives the descriptive statistics of those two columns.
## summary statistics of two columns (numeric column)

df.describe('science_score', 'mathematics_score').show()
so the summary statistics of “science_score” and “mathematics_score” columns will be
Descriptive statistics or summary statistics of a character column in pyspark : method 1
dataframe.select(‘column_name’).describe() gives the descriptive statistics of single column. Descriptive statistics of character column gives
- Count – Count of values of a character column
- Min – Minimum value of a character column
- Max – Maximum value of a character column
## summary statistics of a column (character column)
df.select('name').describe().show()
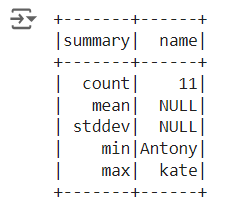
Descriptive statistics or summary statistics of a character column in pyspark : method 2
dataframe.describe() gives the descriptive statistics of single column by passing the column names to the describe() function. Descriptive statistics of character column gives count, Minimum and Maximum value of the column.
## summary statistics of a column (character column)
df.describe('name').show()
so the resultant summary statistics of “name” column will be

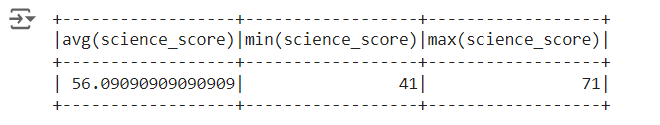
Extract Mean, Min and Max of a column in pyspark using select() function:
Inside the select() function we will be using mean() function, min() function and max() function. which calculates the average value , Minimum value and Maximum value of the column
- Average values of the numeric column – mean()
- Minimum value of the numeric column – min()
- Maximum value of the numeric column – max()
## summary statistics of a column (character column)
df.select([mean('science_score'), min('science_score'), max('science_score')]).show()
so the resultant summary statistics of “science_score” column will be
Other Related Topics:
- Quantile rank, decile rank & n tile rank in pyspark – Rank by Group
- Populate row number in pyspark – Row number by Group
- Percentile Rank of the column in pyspark
- Mean of two or more columns in pyspark
- Sum of two or more columns in pyspark
- Row wise mean, sum, minimum and maximum in pyspark
- Rename column name in pyspark – Rename single and multiple column
- Typecast Integer to Decimal and Integer to float in Pyspark
- Get number of rows and number of columns of dataframe in pyspark
- Extract Top N rows in pyspark – First N rows
- Absolute value of column in Pyspark – abs() function
- Set Difference in Pyspark – Difference of two dataframe
- Union and union all of two dataframe in pyspark (row bind)
- Intersect of two dataframe in pyspark (two or more)
- Round up, Round down and Round off in pyspark – (Ceil & floor pyspark).
![]()
![]()
 and Max() Function in R")

")
")

