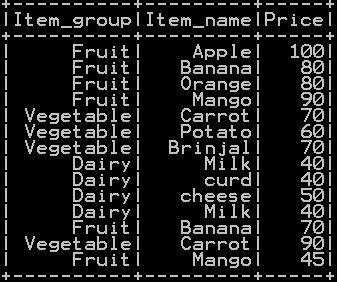
Quantile, Decile and Percentile rank can be calculated using ntile() Function in R. Dplyr package is provided with mutate() function and ntile() function. The ntile() function is used to divide the data into N bins there by providing ntile rank. If the data is divided into 100 bins by ntile(), percentile rank in R is calculated on a particular column. similarly if the data is divided into 4 and 10 bins by ntile() function it will result in quantile and decile rank in R. In this example we will be creating the column with percentile, decile and quantile rank in R by descending order and by group.
- Decile rank of the column in R using ntile() function
- Quantile rank of the column in R
- Percentile rank in R of the particular column using ntile().
- Decile rank, quantile rank and percentile rank by descending order in R
- Percentile rank, quantile rank and decile rank of a group in R.
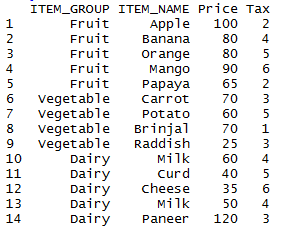
Let’s First Create the dataframe
my_basket = data.frame(ITEM_GROUP = c("Fruit","Fruit","Fruit","Fruit","Fruit","Vegetable","Vegetable","Vegetable","Vegetable","Dairy","Dairy","Dairy","Dairy","Dairy"),
                 ITEM_NAME = c("Apple","Banana","Orange","Mango","Papaya","Carrot","Potato","Brinjal","Raddish","Milk","Curd","Cheese","Milk","Paneer"),
                  Price = c(100,80,80,90,65,70,60,70,25,60,40,35,50,120))
my_basket
we will be using the following my_basket data frame
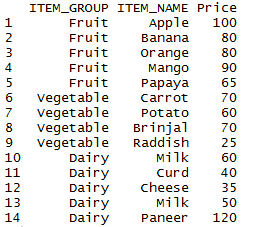
Quantile rank in R:
We will be using my_basket data to depict the example of ntile() function. ntile() function takes column name and 4 as argument which in turn calculates the quantile ranking of the column in R.(i.e. the ranking ranges from 1 to 4)
library(dplyr)


df1 = mutate(my_basket, quantile_rank = ntile(my_basket$Price,4))
df1
So in the resultant data frame quantile rank is calculated and populated across
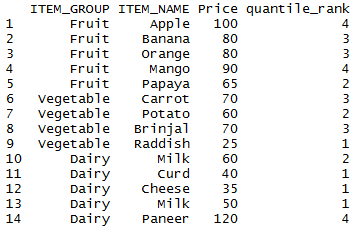
Quantile rank of the column in descending order in R:
ntile() function along with the descending() function, takes column name and 4 as argument which inturn calculates the quantile ranking of the column in descending order in R.(i.e. the ranking ranges from 1 to 4)
library(dplyr)

#### quantile rank of the column in descending order

df1 = mutate(my_basket, quantile_rank = ntile(desc(my_basket$Price),4))
df1
So the resultant data frame with quantile rank calculated in descending order will be
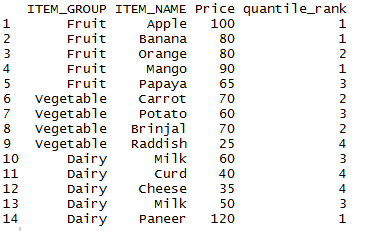
Quantile rank of the column by group in R:
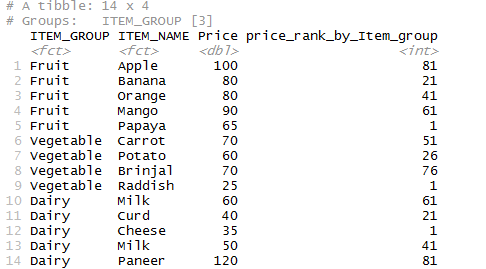
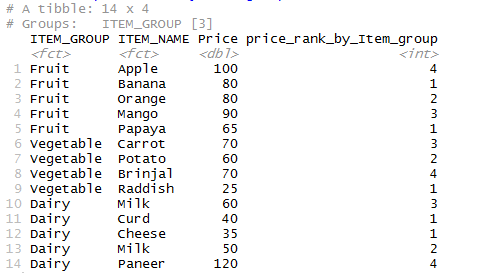
ntile() function along with the group_by() function of dplyr package, groups the column and provides quantile ranking of the “Price” column within that group as shown below.
library(dplyr)
#### quantile rank of the column by group
my_basket %>% group_by(ITEM_GROUP) %>%
  mutate(price_rank_by_Item_group = ntile(Price,4))
So, the resultant data frame with quantile rank calculated by group will be
Decile rank in R:
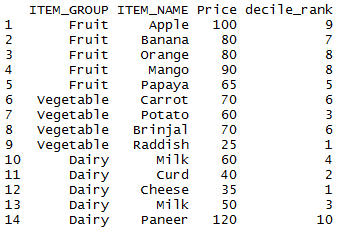
ntile() function takes column name and 10 as argument which inturn calculates the decile ranking of the column in R.(i.e. the ranking ranges from 1 to 10)
library(dplyr)


df1 = mutate(my_basket, decile_rank = ntile(my_basket$Price,10))
df1
So in the resultant data frame decile rank is calculated and populated across
Decile rank of the column in descending order in R:
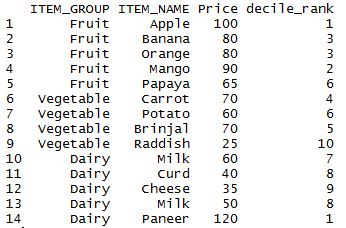
ntile() function along with the descending() function, takes column name and 10 as argument which inturn calculates the decile ranking of the column in descending order in R.(i.e. the ranking ranges from 1 to 10)
library(dplyr)

#### decile rank of the column in descending order

df1 = mutate(my_basket, decile_rank = ntile(desc(my_basket$Price),10))
df1
So the resultant data frame with decile rank calculated in descending order will be
Decile rank of the column by group in R:
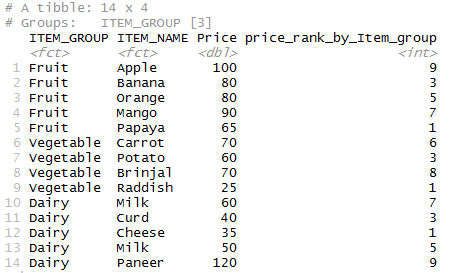
ntile() function along with the group_by() function of dplyr package, groups the column and provides decile ranking of the “Price” column within that group as shown below.
library(dplyr)
#### Decile rank of the column by group

my_basket %>% group_by(ITEM_GROUP) %>%
  mutate(price_rank_by_Item_group = ntile(Price,10))
So, the resultant data frame with decile rank calculated by group will be
Percentile rank in R:
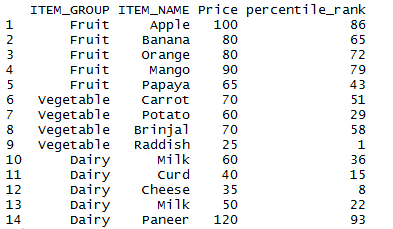
We will be using my_basket data to depict the example of ntile() function. ntile() function takes column name and 100 as argument which in turn calculates the percentile ranking of the column in R.(i.e. the ranking ranges from 1 to 100)
library(dplyr)


df1 = mutate(my_basket, percentile_rank = ntile(my_basket$Price,100))
df1
So in the resultant data frame percentile rank is calculated and populated across
percentile rank of the column in descending order in R:
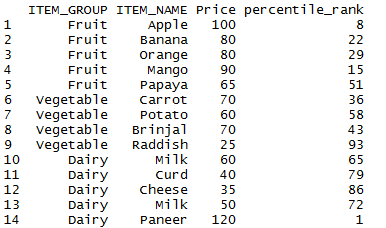
ntile() function along with the descending() function, takes column name and 100 as argument which inturn calculates the percentile ranking of the column in descending order in R.(i.e. the ranking ranges from 1 to 100)
library(dplyr)

#### percentile rank of the column in descending order

df1 = mutate(my_basket, percentile_rank = ntile(desc(my_basket$Price),100))
df1
So the resultant data frame with percentile rank calculated in descending order will be
Percentile rank of the column by group in R:
ntile() function along with the group_by() function of dplyr package, groups the column and provides percentile ranking of the “Price” column within that group as shown below.
library(dplyr)
#### percentile rank by group

my_basket %>% group_by(ITEM_GROUP) %>%
  mutate(price_rank_by_Item_group = ntile(Price,100))
So, the resultant data frame with percentile rank calculated by group will be
