Melting and Casting in R:
One of the most interesting aspects of R programming is about changing the shape of the data to get a desired shape.Melting and casting in R, are the functions that can be used efficiently to reshape the data. The functions used to do this are called melt() and cast().
- Reshape from wide to long using melt() function in R
- Reshape from long to wide using dcast() function in R
Melt Function in R:
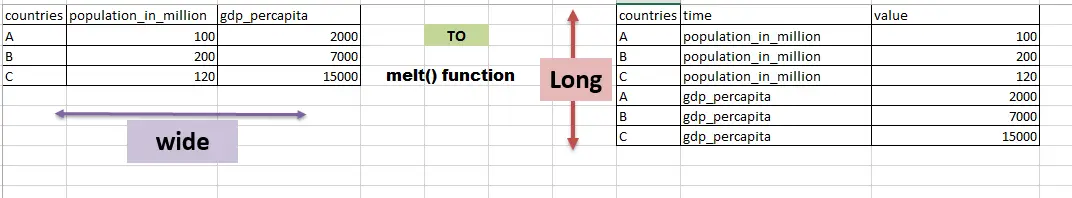
The melt function takes data in wide format and stacks a set of columns into a single column of data. To make use of the function we need to specify a data frame, the id variables (which will be left at their settings) and the measured variables (columns of data) to be stacked. The default assumption on measured variables is that it is all columns that are not specified as id variables.
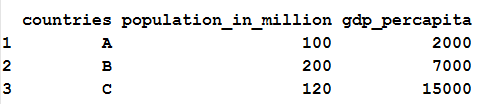
We will below dataframe in R to understand how melt and cast function works. Lets first create the dataframe.
##### Create Dataframe in R
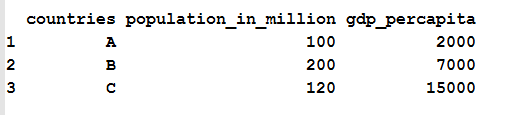
country<-data.frame(c("A","B","C"),c(100,200,120),c(2000,7000,15000))
colnames(country)<- c("countries","population_in_million","gdp_percapita")
country
The data frame “country” will be
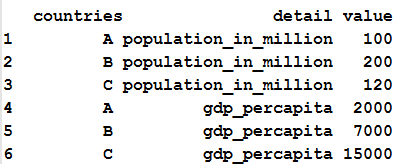
Now lets keep “countries” (id variable) as constant and melt (stack) the other two variables namely population_in_million and gdp_percapita.
##### melt() function in R
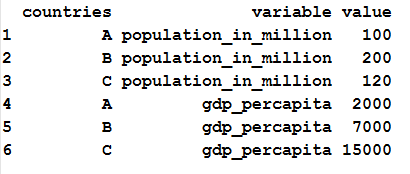
country_w_to_L = melt(country, id.vars=c("countries"))
country_w_to_L
As the result countries column is kept constant. Columns named population_in_million and gdp_percapita are stacked under the column named variable and their values are stacked under the column named value. The result of melt function is shown below
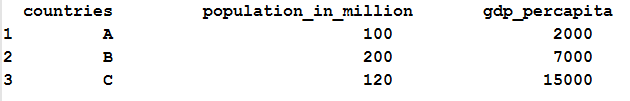
Cast Function in R:
Aggregation occurs when the combination of variables in the cast function does not identify Individual observations. In this case cast function reduces the multiple values to a single one by summing up the values in the value column. Cast function example is shown below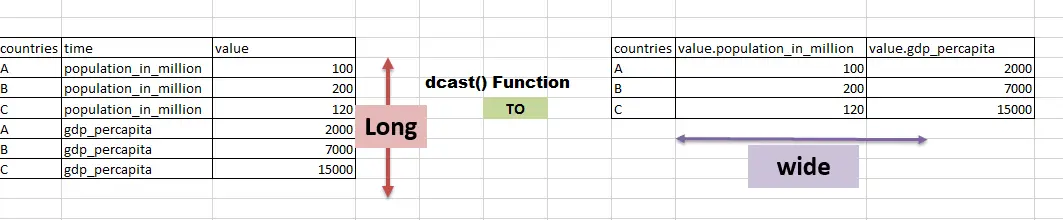
###### long to wide using cast function of reshape2() package in R
country_L_to_W = dcast(country_w_to_L, countries~variable,sum)
country_L_to_W
As the result cast function sums up the different variables for “countries” and those variables are casted back as columns and result is shown below.
For example Countries A with 100 which represents population_in_million and 2000 which represents gdp_percapita is stacked back to single row with the help of dcast() function.
Also refer Reshape from wide to long and long to wide
Alternate Method for melt() and dcast() function in R
Wide to long using gather() function in R using tidyr package:
gather() function of tidyr package in R. gets the table name and the list of columns (population_in_million:gdp_percapita) to be reshaped from wide to long as shown below.
 ## reshape in R from wide to long example
library(tidyr)

data_long = gather(country, detail, value, population_in_million:gdp_percapita, factor_key=TRUE)
data_long
so the resultant dataframe is reshaped from wide to long
Long to wide using spread() function in R using tidyr package:
spread() function of tidyr package in R. gets the table name and the list of columns (detail,value) to be reshaped from long to wide as shown below.
##### long to wide using spread() function of tidyr package
library(tidyr)

data_wide = spread(data_long, details, Value)
data_wide
so the resultant dataframe is reshaped from long to wide
![]()
![]()


 function")


