Matplot in R is most concise way to superimpose the data series. Matplot plots the columns of a matrix individually as a function of x.
Syntax for Matplot in R:
matplot(x,cbind(y1,y2))
- x, y1, and y2 are vectors or column of a matrix or data frame
Example of matplot in R
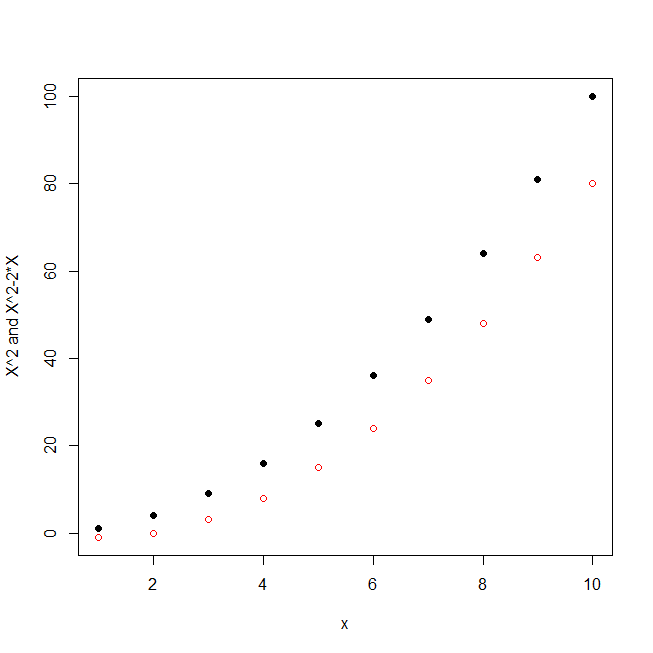
# R matplot

X <- 1:10
Y=X^2
Z=X^2-2*X
matplot(X,cbind(Y,Z),pch=c(16,1),xlab="x",ylab="X^2 and X^2-2*X")
- X is vector from 1 to 10
- Y and Z are function of X
- The command matplot(x,cbind(y,Z)) will produce graph in which has points of the two data series, one is printed in black (col=1) and other is printed in red (col=2).
- xlab and ylab are x axis labels and y axis labels respectively
Note that matplot automatically sets ylim to include both data series.
So the output will be
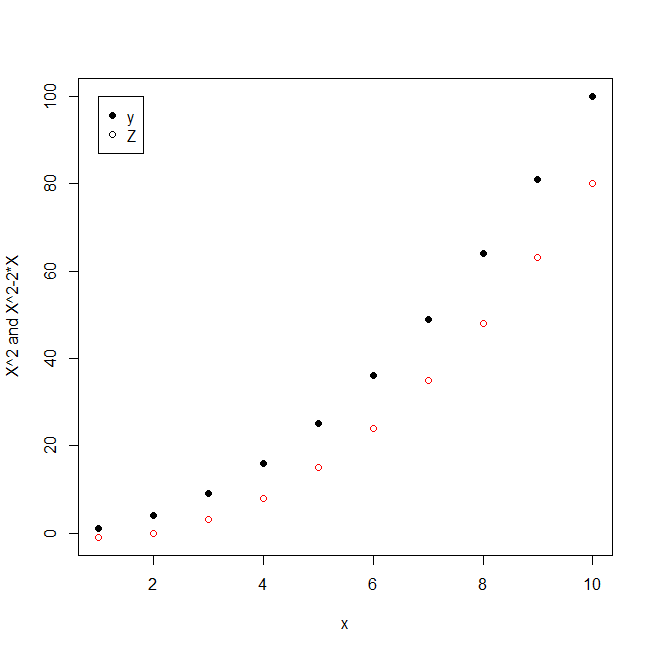
Matplot in R with legend:
To identify the series, add a legend with the legend function, which specifies the x and y coordinates of the legend, its text, accompanying symbols or line types etc
Example of matplot in R with legend
# R matplot with legend

X <- 1:10
Y=X^2
Z=X^2-2*X
matplot(X,cbind(Y,Z),pch=c(16,1),xlab="x",ylab="X^2 and X^2-2*X")
legend(1,100,legend=c("y","Z"),pch=c(16,1))
use bty=”n” if you don’t want box, where bty stands for “box type”.
So the output will be
![]()
![]()
 Function in R")


 in R - Column bind in R")
")