Dot plot in R also known as dot chart is an alternative to bar charts, where the bars are replaced by dots. A simple Dot plot in R can be created using dotchart function dotchart(). Lets see few examples on how to create dot plot.
Syntax of dotchart() function in R for Dot plot:
| NumericVector | Numeric vector to be plotted |
| cex | plot scaling factor(size) . More the value of cex, more the plot size will be |
| col | colour of the dot |
| labels | A vector containing the label names for each plotted value. |
| main | Title of the dot chart |
| pch | numeric value which decides the type of plot … if pch=1 then dot, pch=2 then triangle, pch=3 then ‘+’ |
| sub | subtitle of the dot chart |
| xlab | x axis label |
Example of dot plot in R
We will use the PlantGrowth data set to depict an example of R dot plot
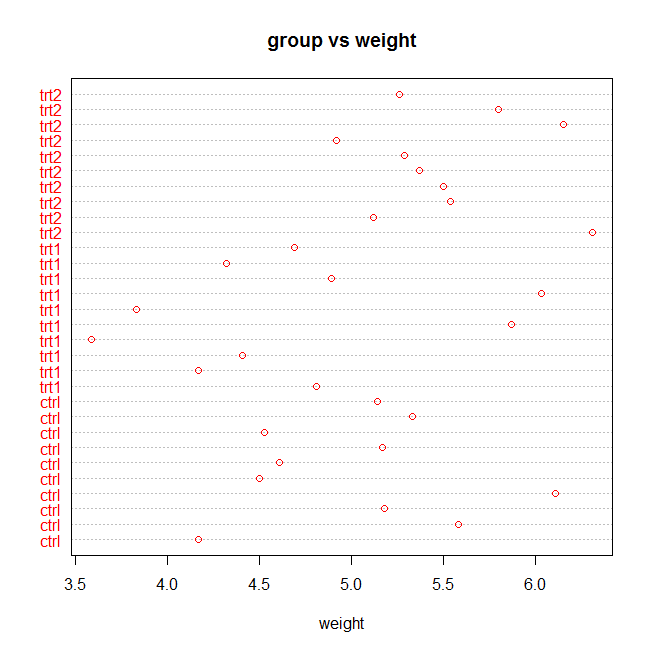
#simple dot plot in R

dotchart(PlantGrowth$weight,col="red",pch=1,labels=PlantGrowth$group,
main="group vs weight",
xlab="weight")
the above dotchart() function takes up numeric vector as first argument and plots the red dots with labels and title. So the output will be
Dot plot in R for groups:
Suppose if we want to create the different dot plots for different group of the same data set, how to do that? For Example PlantGrowth data set have 3 groups ctrl, trt1 and trt2. Lets demonstrate how to differentiate among these 3 groups while plotting a dot chart
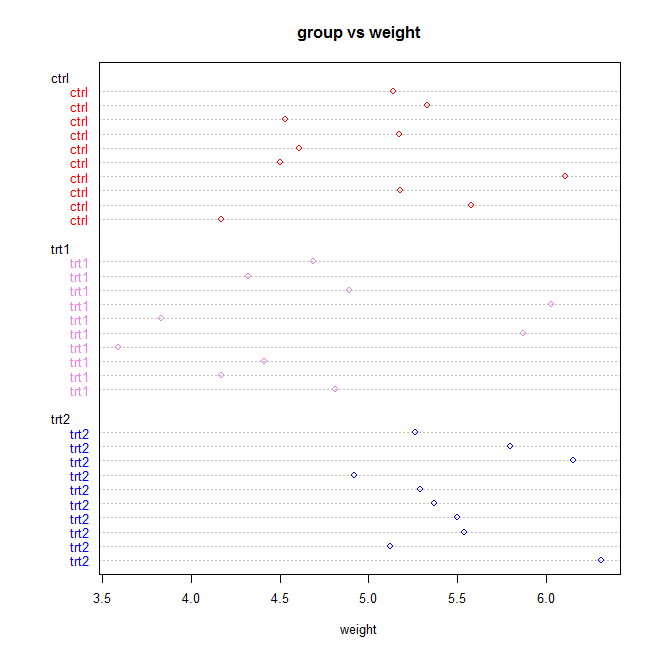
#Dot chart in R for groups
#subset and assign colour

pg <- PlantGrowth
pg$color[pg$group=="ctrl"] <- "red"
pg$color[pg$group=="trt1"] <- "Violet"
pg$color[pg$group=="trt2"] <- "blue"


# plot the dot chart
dotchart(PlantGrowth$weight, labels=PlantGrowth$group,cex=0.8,groups= PlantGrowth$group,
main="group vs weight",
xlab="weight", gcolor="black", color=pg$color)
First subset the groups and assign different colour for different groups. Then with the help of dotchart() function use the argument, groups= PlantGrowth$group and color= pg$color as shown above
So the output will be
![]()
![]()


 Function in R")


 and gsub() function in R")