Mosaic plot is a graphical representation of two way contingency table which pictographically represents the relationship among two or more categorical variables. Plot is divided into rectangles. In this tutorial, let’s see how to create a mosaic plot in R
Concept behind the mosaic plot:
Let’s consider the UCBAdmisssions data set.
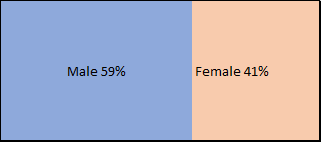
First Split: male and female ratio
| male | 2691 |
| female | 1835 |
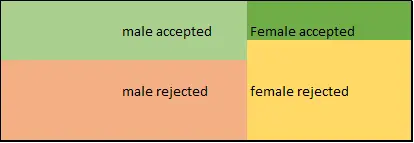
Second split : admission and rejection on male and female
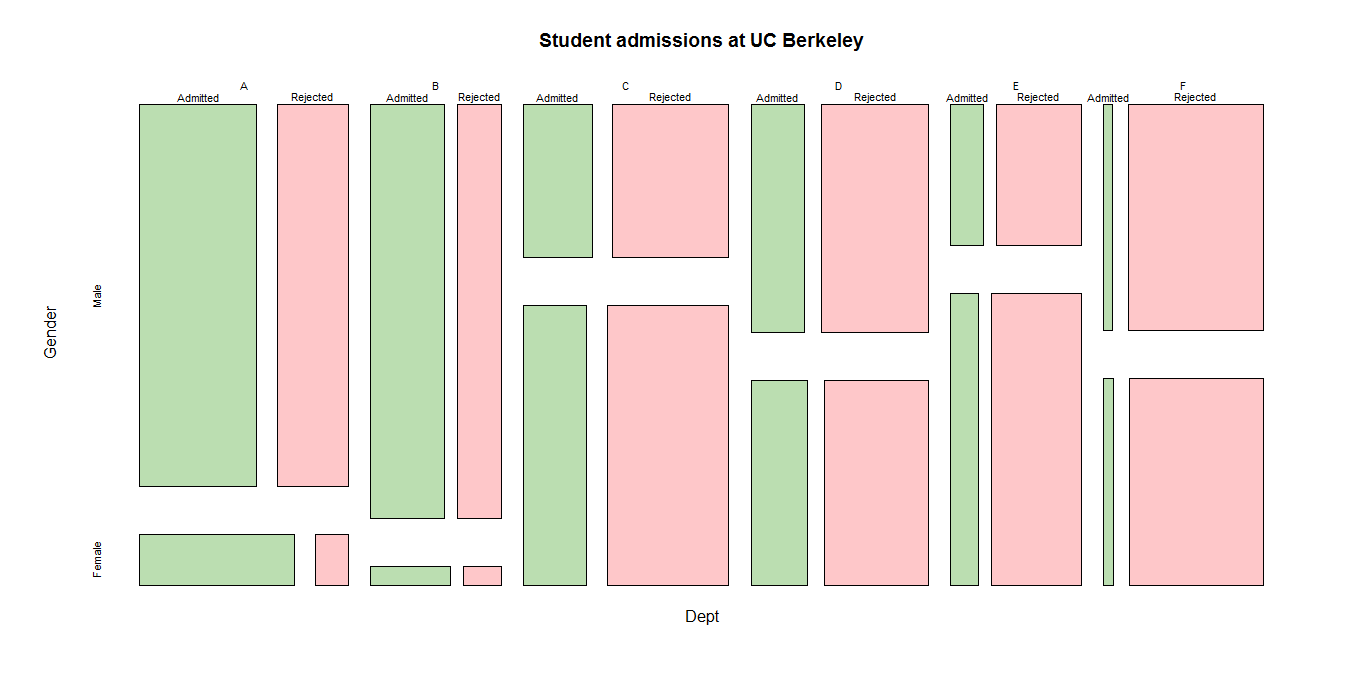
Third split: admission and rejection across departments on male and female
| Male | Female | ||
| Department A | Admitted | 512 | 89 |
| Rejected | 313 | 19 | |
| Department B | Admitted | 353 | 17 |
| Rejected | 207 | 8 | |
| Department C | Admitted | 120 | 202 |
| Rejected | 205 | 391 | |
| Department D | Admitted | 138 | 131 |
| Rejected | 279 | 244 | |
| Department E | Admitted | 53 | 94 |
| Rejected | 138 | 299 | |
| Department F | Admitted | 22 | 24 |
| Rejected | 351 | 317 |
So the plot will be
How to create mosaic plot in R:
Mosaic plot in R can be created with mosaicplot() function as shown below
# mosaic plot in R with mosaicplot function

mosaicplot(UCBAdmissions, sort = 3:1,
col = hcl(c(120, 10)),
main = "Student admissions at UC Berkeley")
- first argument is the dataset
- second argument is vector ordering of the variables
- third argument is coloring the plot
- last argument is the mosaic plot heading
so the final mosaic plot will be
![]()
![]()


 in R using Dplyr – select () Function")
")
