Quantile – Quantile plot in R which is also known as QQ plot in R is one of the best way to test how well the data is distributed normally. QQ plot is even better than histogram to test the normality of the data. we will be plotting Q-Q plot with qqnorm() function in R. Q-Q plot in R is explained with example.
For what QQ plot is used for ?
- QQ plot is used to test the normality of a data
- QQ plot is used to compare two data
Let’s see both with an example
Quantile – Quantile plot in R to test the normality of a data:
In R, qqnorm() function plots your data against a standard normal distribution.
- Give data as an input to qqnorm() function
- R takes up this data and create a sample values with standard normal distribution
- Then R compares these two data sets (input data set and generated standard normal data set)
- Sorts both the data sets
- Then finally plots these two sorted data sets against each other.
All the above steps are done simply by using QQnorm function in R
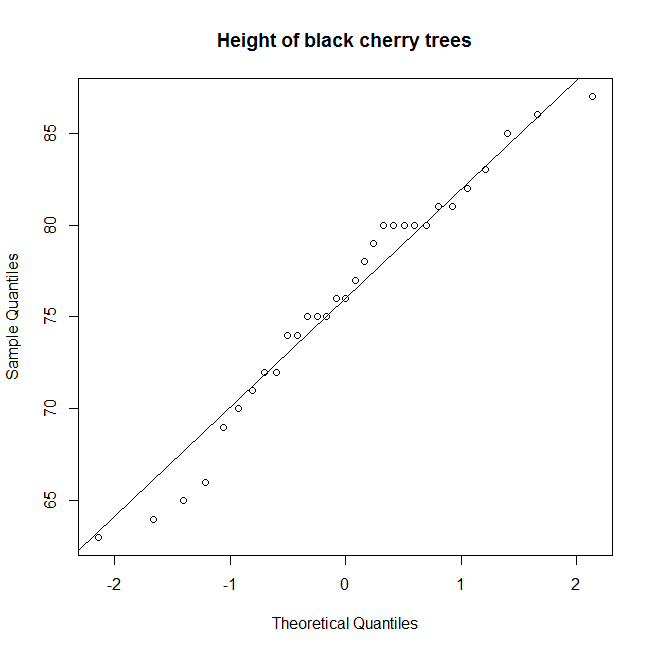
Quantile – Quantile plot in R Example (test the normality):
Let consider inbuilt “trees” data set and let’s check the normality of trees height
# QQ plot in R to test the normality of data

qqnorm(trees$Height,main="Height of black cherry trees")
qqline(trees$Height) ## adds the line to the plot
when we give trees height as an input to the qqnorm() function in R. R executes all the above mentioned steps and returns the following QQ plot
Quantile – Quantile plot in R to compare two data set:
- In this method R simply takes up two data sets
- Sorts both the data sets
- Plots these two sorted data sets against each other.
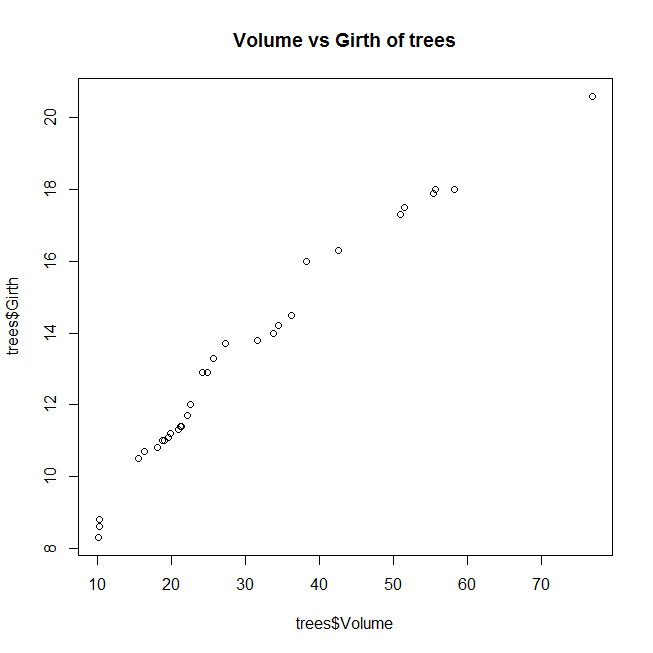
Example of QQ plot in R (compare two data set):
Lets use same trees data set and compare the trees Girth and its Volume with QQ plot function as shown below
# QQ plot in R to compare two data samples

qqplot(trees$Volume,trees$Girth, main="Volume vs Girth of trees")
two data (volume and girth) are sorted and plotted against each other, so the output will be
![]()
![]()


")
