Descriptive Statistics of the dataframe in R can be calculated by 3 different methods. Let’s see how to calculate summary statistics of each column of dataframe in R with an example for each method. summary() function in R is used to get the summary statistics of the column
- Descriptive statistics with summary function in R
- Summary statistics in R using stat.desc() function from “pastecs” package
- Descriptive statistics with describe() function from “Hmisc” package
- summarise() function of the dplyr package in R
Let’s first create the dataframe.
### Create Data Frame
df1 = data.frame(Name = c('George','Andrea', 'Micheal','Maggie','Ravi','Xien','Jalpa'),
Grade_score=c(4,6,2,9,5,7,8),
Mathematics1_score=c(45,78,44,89,66,49,72),
Science_score=c(56,52,45,88,33,90,47))
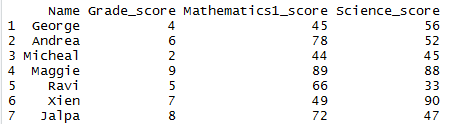
df1
So the resultant dataframe will be
Descriptive statistics in R (Method 1):
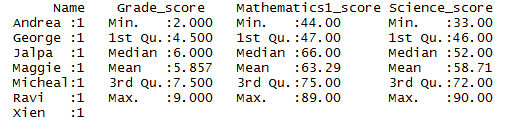
summary statistic is computed using summary() function in R. summary() function is automatically applied to each column. The format of the result depends on the data type of the column.
- If the column is a numeric variable, mean, median, min, max and quartiles are returned.
- If the column is a factor variable, the number of observations in each group is returned.
Descriptive statistics in R with simple summary function calculates
- minimum value of each column
- maximum value of each column
- mean value of each column
- median value of each column
- 1st quartile of each column (25th percentile)
- 3rd quartile of each column (75th percentile)
as shown below
# Summary statistics of dataframe in R

summary(df1)
summary statistics is
summary statistics of a single column in R:
Five values of a specified column is returned: the mean, median, 25th and 75th quartiles, min and max in one single line call:
# Summary statistics of a column in R

 summary(df1$Science_score)
so the summary statistics of the “Science_score” column will be
![]()
Summary / Descriptive statistics in R (Method 2):
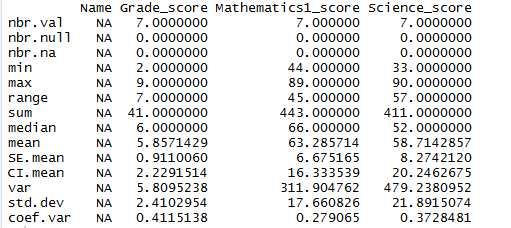
Descriptive statistics in R with pastecs package does bit more than simple describe () function. It also Calculates
- number of missing values and null of each column in R
- number of non missing values of each column
- sum , range ,variance and standard deviation etc for each column
# descripive statistics of dataframe in R

install.packages("pastecs")
library(pastecs)
stat.desc(df1)
summary statistics is
Summary statistics in R (Method 3):
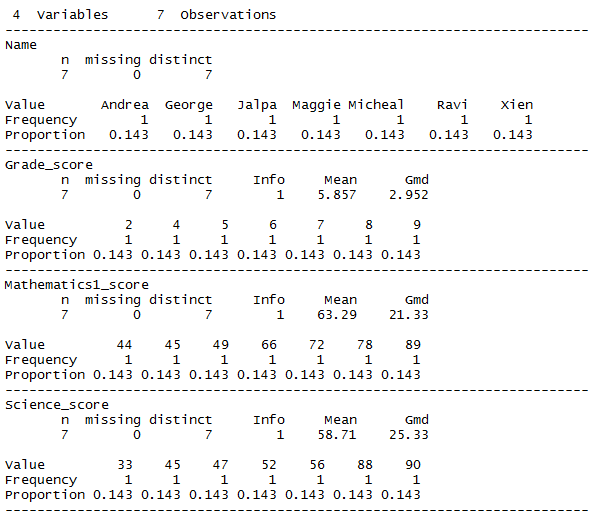
Descriptive statistics in R with Hmisc package calculates the distinct value of each column, frequency of each value and proportion of that value in that column. as shown below
# Summary statistics of dataframe in R

install.packages("Hmisc")
library(Hmisc)
describe(df1)
summary statistics is
Summarise using dplyr() package in R
We will be using mtcars data to depict the example of summarise function.
library(dplyr)
mydata = mtcars

# summarise the columns of dataframe
summarise(mydata, mpg_mean=mean(mpg),mpg_median=median(mpg))
summarise() function that gets the mean and median of mpg.
![]()
summarise_all()
The summarise_all() function allows you to summarise all the variables.
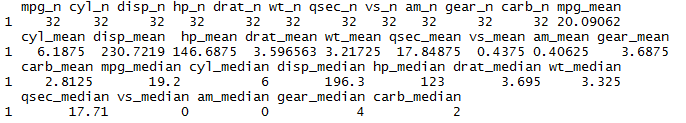
library(dplyr)
mydata = mtcars

# summarise all the column of dataframe
summarise_all(mydata,funs(n(),mean,median))
summarise_all() function that gets the number of rows, mean and median of all the columns.
Summarize categorical or factor Variable:
We will be summarizing the number of levels/categories and count of missing observations in a categorical (factor) variable. Let’s use iris dataset for example
library(dplyr)

mydata2 = iris
summarise_all(mydata2["Species"], funs(nlevels(.), nmiss=sum(is.na(.))))
In the iris dataset “Species” column has three distinct levels and zero missing values as shown below.
![]()
For further understanding of summary statistics using dplyr package in R refer the dplyr documentation
Other Related Topics:
![]()
![]()


 in R using Dplyr – select () Function")
")
