In this Tutorial we will learn how to create pie chart in python with matplot library using an example. This python Pie chart tutorial also includes the steps to create pie chart with percentage values, pie chart with labels and legends
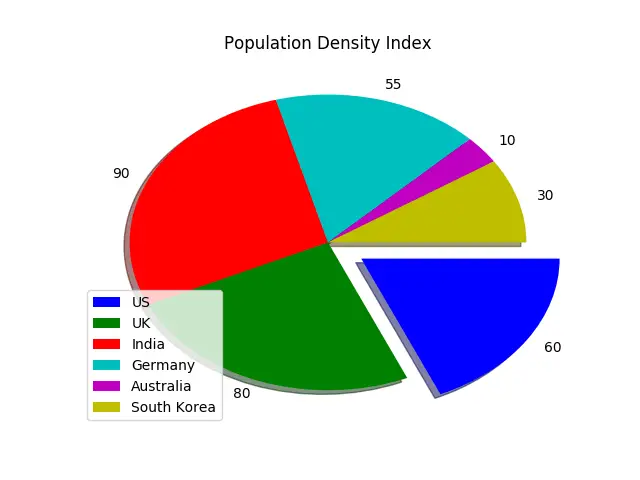
Create Pie chart in Python with legends:
import matplotlib.pyplot as plt

values = [60, 80, 90, 55, 10, 30]
colors = ['b', 'g', 'r', 'c', 'm', 'y']
labels = ['US', 'UK', 'India', 'Germany', 'Australia', 'South Korea']
explode = (0.2, 0, 0, 0, 0, 0)
plt.pie(values, colors=colors, labels= values,explode=explode,counterclock=False, shadow=True)
plt.title('Population Density Index')
plt.legend(labels,loc=3)
plt.show()
Line 1: Imports the pyplot function of matplotlib library in the name of plt.
Line 3 : Inputs the arrays to the variables named values which denotes happiness index in our case.
Line 4 and Line 5 : Array of input colors and array of labels which are countries
Line 6: first value is exploded out (projected out) by 0.2
Line 7: inputs all above values to pie() function of pyplot. Values are displayed clock wise with counterclock=False.
Line 8: Assigns Title to the pie chart.
Line 9 and Line 10: adds Legend and places at location 3 which is bottom left corner and Shows the pie chart with legend.
pie chart with legends and labels in python is plotted as shown below
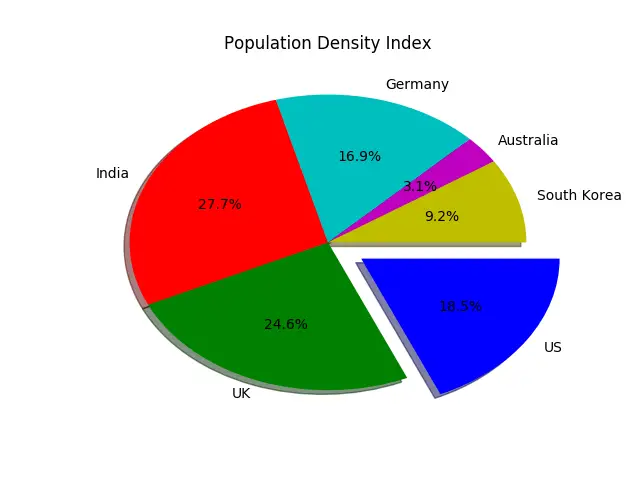
Create Pie chart in Python with percentage values:
import matplotlib.pyplot as plt

values = [60, 80, 90, 55, 10, 30]
colors = ['b', 'g', 'r', 'c', 'm', 'y']
labels = ['US', 'UK', 'India', 'Germany', 'Australia', 'South Korea']
explode = (0.2, 0, 0, 0, 0, 0)
plt.pie(values, colors=colors, labels=labels,
explode=explode, autopct='%1.1f%%',
counterclock=False, shadow=True)
plt.title('Population Density Index')
plt.show()
Line 7: Inputs all above values, colors, label to pie() function of pyplot. Argument named autopct converts the values in terms of percentages and plots it in the pie chart. Values are displayed clock wise with counterclock=False.
pie chart in python with percentage values is shown below
![]()
![]()
 Function in R")


