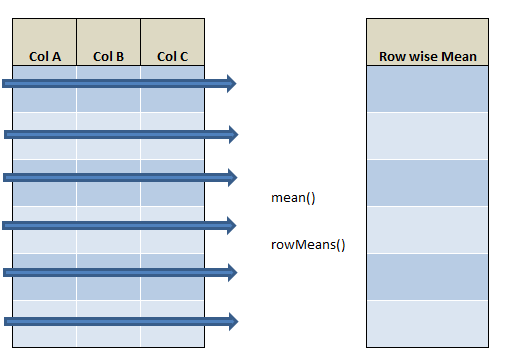
Row wise mean of the dataframe or mean value of each row in R is calculated using rowMeans() function. Other method to get the row mean in R is by using apply() function.row wise mean of the dataframe is also calculated using dplyr package. rowwise() function of dplyr package along with the mean function is used to calculate row wise mean. we will be looking at the following examples
- Row wise mean of R dataframe using rowMeans()
- Row mean of the dataframe using apply() function.
- Row wise mean of the dataframe using dplyr package.
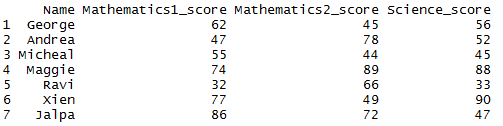
First let’s create the dataframe
#### Create DataFrame
df1 = data.frame( Name = c('George','Andrea', 'Micheal','Maggie','Ravi','Xien','Jalpa'),
 Mathematics1_score=c(62,47,55,74,32,77,86),
 Mathematics2_score=c(45,78,44,89,66,49,72),
 Science_score=c(56,52,45,88,33,90,47))

df1
df1 will be
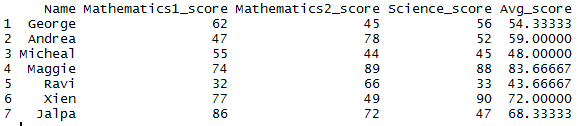
Row wise mean in R dataframe using rowMeans() :
Let’s calculate the row wise mean in R using rowMeans() function as shown below. rowMeans() function takes up column 2 to 4 and performs row wise mean.
## row wise mean using rowMeans()

df1$Avg_score = rowMeans(df1[,c(2,3,4)])
df1
or
## row wise mean using rowMeans()

df1$Avg_score = rowMeans(df1[,c(-1)])
df1
So the resultant dataframe will be
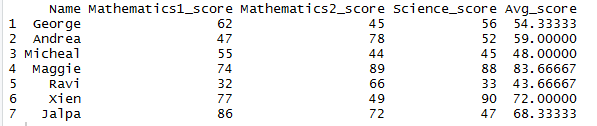
Row wise mean in R dataframe using apply() function:
Let’s calculate the row wise mean using apply() function as shown below. apply() function takes three arguments first argument is dataframe without first column and second argument is used to perform row wise operation (argument 1- row wise ; 2 – column wise ). third argument mean function which calculates mean values. so here it performs row wise mean
### Row wise mean using apply() function

df1$Avg_score = apply(df1[,-1], 1, mean)
df1
So the resultant dataframe with row wise mean calculated will be
Row wise mean of the dataframe using dplyr: Method 1
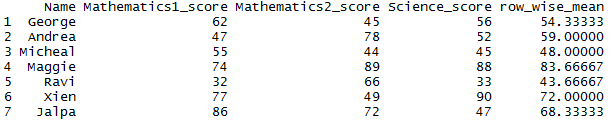
rowMeans() function takes up the columns 2 to 4 and performs the row wise operation with NA values replaced to zero. row wise mean is calculates using pipe (%>%) operator of the dplyr package.
##### Dplyr row wise mean
library(dplyr)

df1 %>% replace(is.na(.), 0) %>% mutate(row_wise_mean = rowMeans(.[2:4]))
So the resultant dataframe with row wise mean calculated will be
Row wise mean of the dataframe using dplyr: Method 2
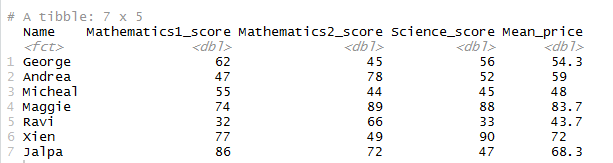
Row wise mean is calculated with the help rowwise() function of dplyr package and mean() function as shown below
## row wise mean using dplyr

library(dplyr)

df1 %>%
  rowwise() %>%
  mutate(
    Mean_price = mean(c(Mathematics1_score,Mathematics2_score,Science_score))
  )
row wise mean of “Mathematics1_score” , “Mathematics2_score” and “Science_score” is calculated and populated for each row as shown below
For more Details kindly refer to matrixStats package in R
Other Related Topics
![]()
![]()


 and Max() Function in R")
 in R using Dplyr – select () Function")

