Legend function in R adds legend box to the plot. legend() function in R makes graph easier to read and interpret in better way. lets see an example on how to add legend to a plot with legend() function in R.
Syntax of Legend function in R:
| x, y | the x and y co-ordinates which is used to position the legend. |
| legend | a character vector of legend names |
| fill | fill legend box with the specified colors. |
| col | the color of points or lines appearing in the legend. |
| border | the border color for the legend box |
| lty, lwd | the line types and widths for lines appearing in the legend. |
| pch | the plotting symbols appearing in the legend |
Example of Legend function in R:
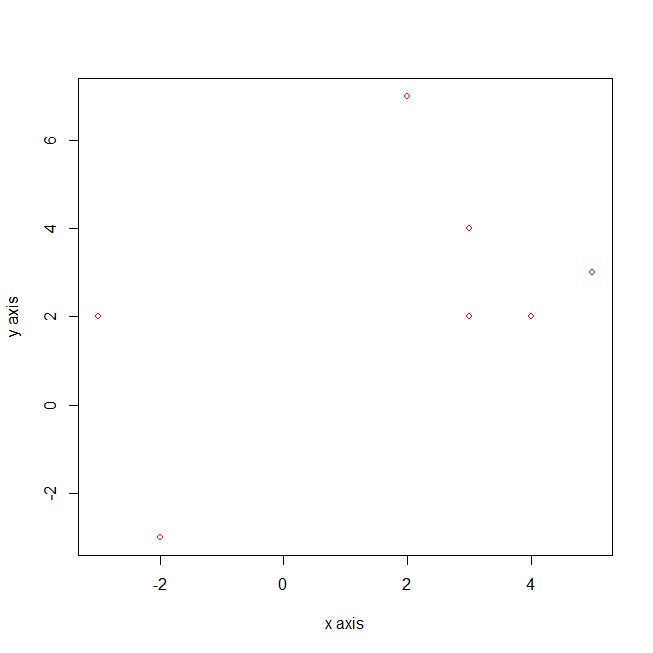
Let’s depict how to create legend in R with an example. Before that lets create basic scatter plot using plot() function with red colored rounded dots as shown below.
#plot a scatter plot

x1 <- c(3,3,4,-3,-2,5,2)
y1 <- c(2,4,2,2,-3,3,7)
plot(x1,y1,cex=.8,pch=1,xlab="x axis",ylab="y axis",col="red")
output will be
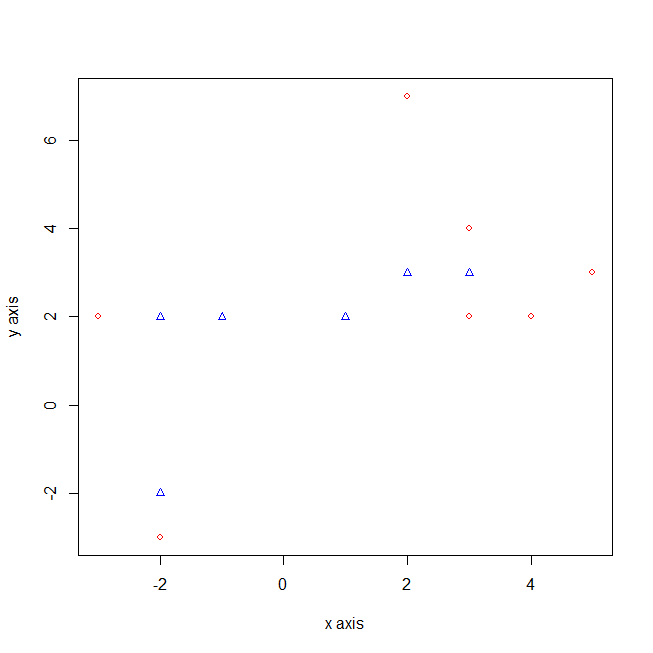
Now, lets again add an another sets of scatter plot with point function with blue color pyramids as shown below.
#plot an another scatter plot with points function

x2 <- c(1,2,-2,-1,-2,3)
y2 <- c(2,3,2,2,-2,3)
points(x2,y2,cex=.8,pch=2,col="blue")
So the resultant chart will be
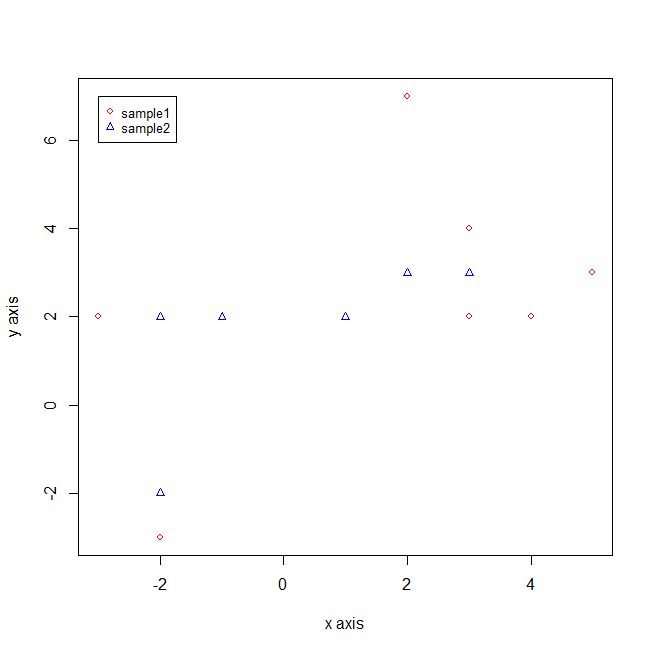
Add legend to the top left corner of the plot with legend function in R:
Now let’s add the legend to the above scatter plot with legend function in R, to make it more readable
## adding legend to the top left of the plot

legend(x=-3,y=7,c("sample1","sample2"),cex=.8,col=c("red","blue"),pch=c(1,2))
In the above function we have added legend to the top left corner of the graph at co-ordinates x= -3 and y=7 so the output will be
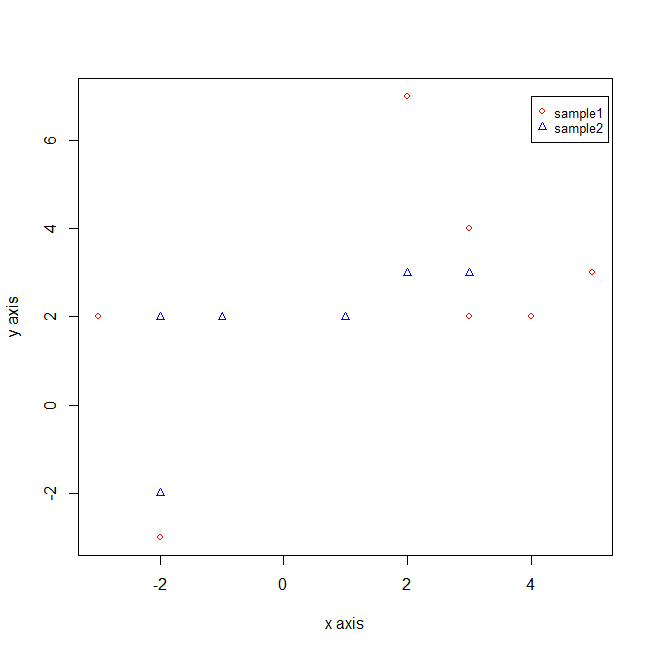
Add legend to the top right corner of the plot with legend function in R:
## adding legend to the top right corner of the plot

legend(x=4,y=7,c("sample1","sample2"),cex=.8,col=c("red","blue"),pch=c(1,2))
In the above function we have added legend to the top right corner of the graph at co-ordinates x= 4 and y=7 so the output will be
Specify legend position by keywords
The position of the legend can be specified also using the following keywords : “bottomright”, “bottom”, “bottomleft”, “left”, “topleft”, “top”, “topright”, “right” and “center”.
The effect of using each of these keywords are shown in the figure below :

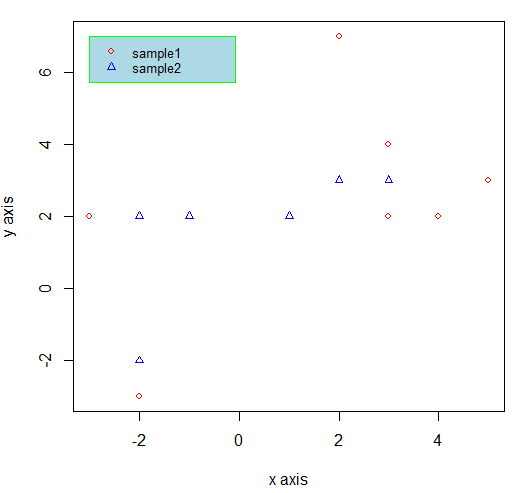
Add legend Box and background color to legend box:
A Green color box is added to the legend using box.col=”green”. and the background of this box is filled with light blue using bg= “lightblue” as shown below.
#### legend with green color box  and with light blue back ground

legend(x=-3,y=7,c("sample1","sample2"),cex=.8,col=c("red","blue"),pch=c(1,2),box.col="green",  bg='lightblue')
so the resultant plot will have green color box, with light blue back ground
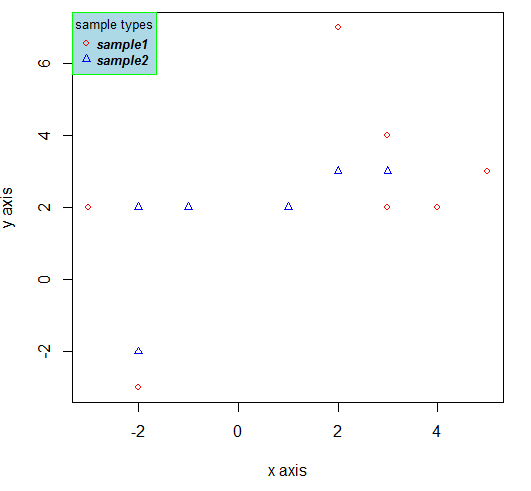
Add Title and font to the legend
Title is added to the legend using Title keyword. Font of that title can be assigned with text.font keyword.
title: The title of the legend
text.font: an integer specifying the font style of the legend text; possible values are :
1: normal
2: bold
3: italic
4: bold and italic
#### legend with box,title, background and title font

legend("topleft",c("sample1","sample2"),cex=.8,col=c("red","blue"),pch=c(1,2),box.col="green", title="sample types", text.font=4,  bg='lightblue')
so the resultant plot will have green color box, with light blue back ground, With Bold italic title as legend on the top left corner is shown below
for further details kindly refer here
![]()
![]()


")


