In this section we will learn how to create Box plot in python using matplotlib with an example. This python Box plot section also includes the steps to create Horizontal Box plot, Vertical Box plot and box plot with notch.
Create box plot in python:
import matplotlib.pyplot as plt

value1 = [82,76,24,40,67,62,75,78,71,32,98,89,78,67,72,82,87,66,56,52]
value2=[62,5,91,25,36,32,96,95,3,90,95,32,27,55,100,15,71,11,37,21]
value3=[23,89,12,78,72,89,25,69,68,86,19,49,15,16,16,75,65,31,25,52]
value4=[59,73,70,16,81,61,88,98,10,87,29,72,16,23,72,88,78,99,75,30]

box_plot_data=[value1,value2,value3,value4]
plt.boxplot(box_plot_data)
plt.show()
- Four arrays are passed to an array named box_plot_data and it is plotted with boxplot function. Which is shown below.

Create box plot in python with fills and labels:
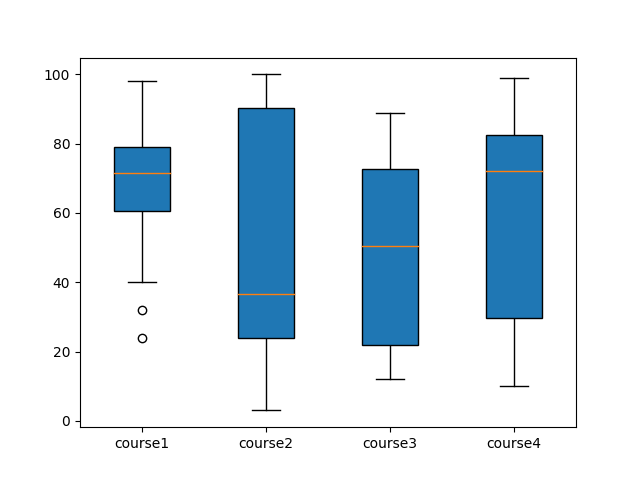
import matplotlib.pyplot as plt

value1 = [82,76,24,40,67,62,75,78,71,32,98,89,78,67,72,82,87,66,56,52]
value2=[62,5,91,25,36,32,96,95,3,90,95,32,27,55,100,15,71,11,37,21]
value3=[23,89,12,78,72,89,25,69,68,86,19,49,15,16,16,75,65,31,25,52]
value4=[59,73,70,16,81,61,88,98,10,87,29,72,16,23,72,88,78,99,75,30]

box_plot_data=[value1,value2,value3,value4]
plt.boxplot(box_plot_data,patch_artist=True,labels=['course1','course2','course3','course4'])
plt.show()
- boxplot() function takes the data array to be plotted as input in first argument, second argument patch_artist=True , fills the boxplot and third argument takes the label to be plotted.
Create box plot in python with notch
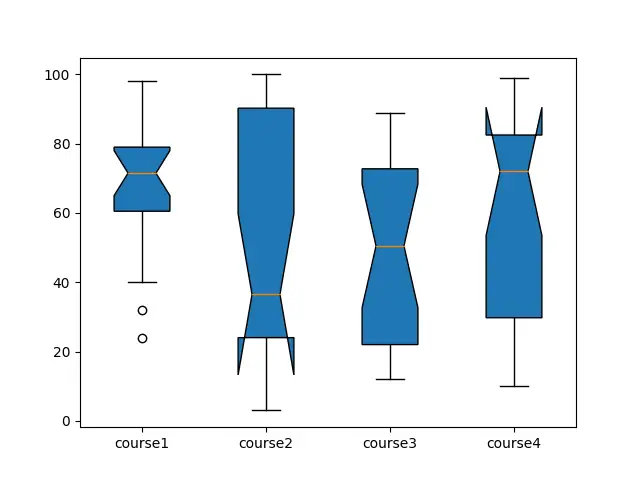
import matplotlib.pyplot as plt

value1 = [82,76,24,40,67,62,75,78,71,32,98,89,78,67,72,82,87,66,56,52]
value2=[62,5,91,25,36,32,96,95,3,90,95,32,27,55,100,15,71,11,37,21]
value3=[23,89,12,78,72,89,25,69,68,86,19,49,15,16,16,75,65,31,25,52]
value4=[59,73,70,16,81,61,88,98,10,87,29,72,16,23,72,88,78,99,75,30]

box_plot_data=[value1,value2,value3,value4]
plt.boxplot(box_plot_data,notch='True',patch_artist=True,labels=['course1','course2','course3','course4'])
plt.show()
- boxplot() function takes the data array to be plotted as input in first argument, second argument notch=‘True’ creates the notch format of the box plot. Third argument patch_artist=True, fills the boxplot with color and fourth argument takes the label to be plotted.
Horizontal box plot in python with different colors:
import matplotlib.pyplot as plt

value1 = [82,76,24,40,67,62,75,78,71,32,98,89,78,67,72,82,87,66,56,52]
value2=[62,5,91,25,36,32,96,95,3,90,95,32,27,55,100,15,71,11,37,21]
value3=[23,89,12,78,72,89,25,69,68,86,19,49,15,16,16,75,65,31,25,52]
value4=[59,73,70,16,81,61,88,98,10,87,29,72,16,23,72,88,78,99,75,30]

box_plot_data=[value1,value2,value3,value4]
box=plt.boxplot(box_plot_data,vert=0,patch_artist=True,labels=['course1','course2','course3','course4'],
            )

colors = ['cyan', 'lightblue', 'lightgreen', 'tan']
for patch, color in zip(box['boxes'], colors):
    patch.set_facecolor(color)

plt.show()
- boxplot() function takes argument vert =0 which plots the horizontal box plot.
- Colors array takes up four different colors and passed to four different boxes of the boxplot with patch.set_facecolor() function.

![]()
![]()


