Aggregate() Function in R Splits the data into subsets, computes summary statistics for each subsets and returns the result in a group by form. Aggregate function in R is similar to group by in SQL. Aggregate() function is useful in performing all the aggregate operations like sum,count,mean, minimum and Maximum.
Lets see an Example of following
- Aggregate() method which computes group sum
- calculate the group max and minimum using aggregate() Method
- Aggregate() method which computes group mean
- Get group counts using aggregate() function.
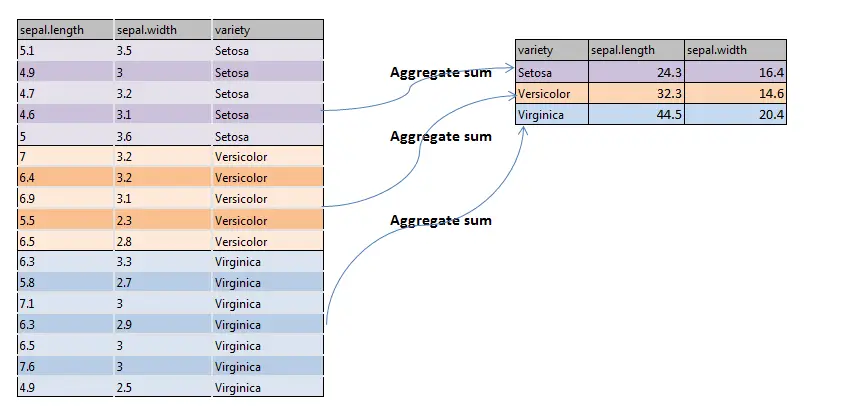
A pictographical representation of aggregate() function i.e. aggregate sum is shown below
Syntax for Aggregate() Function in R:
| X | an R object, Mostly a dataframe |
| by | a list of grouping elements, by which the subsets are grouped by |
| FUN | a function to compute the summary statistics |
| simplify | a logical indicating whether results should be simplified to a vector or matrix if possible |
| drop | a logical indicating whether to drop unused combinations of grouping values. |
Example of Aggregate() Function in R:
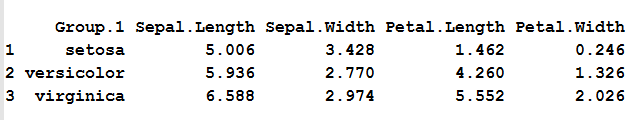
Let’s use the iris data set to demonstrate a simple example of aggregate function in R. We all know about iris dataset. Suppose if want to find the mean of all the metrics (Sepal.Length Sepal.Width Petal.Length Petal.Width) for the distinct species then we can use aggregate function
# Aggregate function in R with mean summary statistics
agg_mean = aggregate(iris[,1:4],by=list(iris$Species),FUN=mean, na.rm=TRUE)
agg_mean
the above code takes first 4 columns of iris data set and groups by “species” by computing the mean for each group, so the output will be
note: When using the aggregate() function, the by variables must be in a list.
Example for aggregate() function in R with sum:
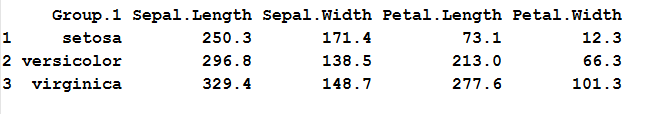
Let’s use the aggregate() function in R to create the sum of all the metrics across species and group by species.
# Aggregate function in R with sum summary statistics
agg_sum = aggregate(iris[,1:4],by=list(iris$Species),FUN=sum, na.rm=TRUE)
agg_sum
When we execute the above code, the output will be
Example for aggregate() function in R with count:
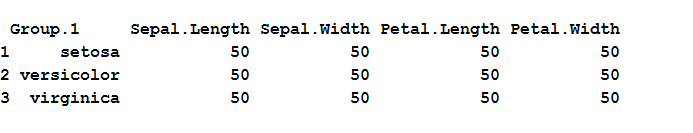
Let’s use the aggregate() function to create the count of all the metrics across species and group by species.
# Aggregate function in R with count
agg_count = aggregate(iris[,1:4],by=list(iris$Species),FUN=length)
agg_count
the above code takes first 4 columns of iris data set and groups by “species” by computing the count for each group, so the output will be
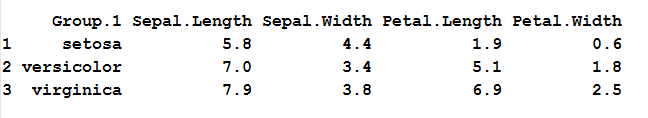
Example for aggregate() function in R with maximum:
Let’s use the aggregate() function to create the maximum of all the metrics across species and group by species.
# Aggregate function in R with maximum
agg_max = aggregate(iris[,1:4],by=list(iris$Species),FUN=max, na.rm=TRUE)
agg_max
the above code takes first 4 columns of iris data set and groups by “species” by computing the max for each group, so the output will be
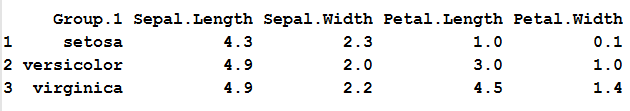
Example for aggregate() function in R with minimum:
Let’s use the aggregate() function to create the minimum of all the metrics across species and group by species.
# Aggregate function in R with minimum
agg_min = aggregate(iris[,1:4],by=list(iris$Species),FUN=min, na.rm=TRUE)
agg_min
the above code takes first 4 columns of iris data set and groups by “species” by computing the min for each group, so the output will be
![]()
![]()


 and Max() Function in R")
")

